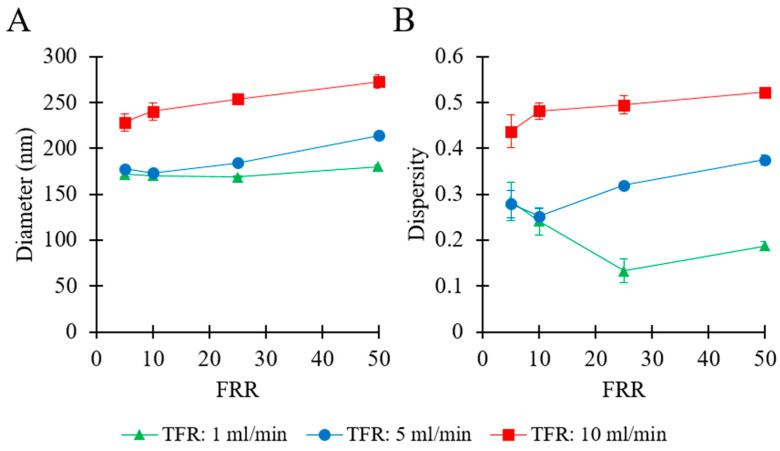
Figure 2.
Effects of total flow rate (TFR) and flow rate ratio (FRR) on liposome Z-average size (A) and dispersity (B). Data represent the means of three measurements with corresponding standard deviations. Refer to Table 1 (batch code #1 PC to #12 PC) for the corresponding experimental conditions, lipid compositions, and numerical data of mean values and standard deviations.

