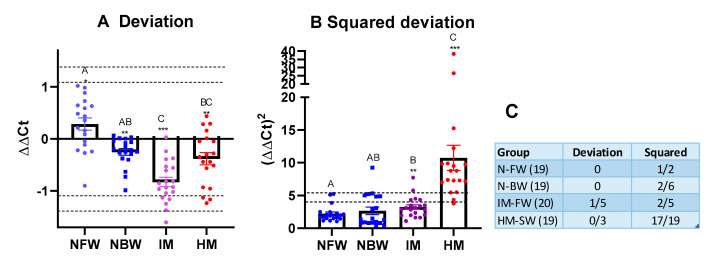
Figure 3.
Comparison of smolts with different performance with the Gill Reference Data Set (GRDS). Each mark (circle, square or rectangle) corresponds to an individual. (A) Mean deviation; (B) squared deviation. Columns not sharing common letters are significantly different (ANOVA, Tukey’s test, p < 0.05). Asterisks mark difference from GRDS by the mean values: * < 0.05, ** < 0.01, and *** < 0.001. Dotted lines denote fifth and tenth percentile thresholds. (C) Numbers of fish exceeding thresholds (fifth/tenth).

