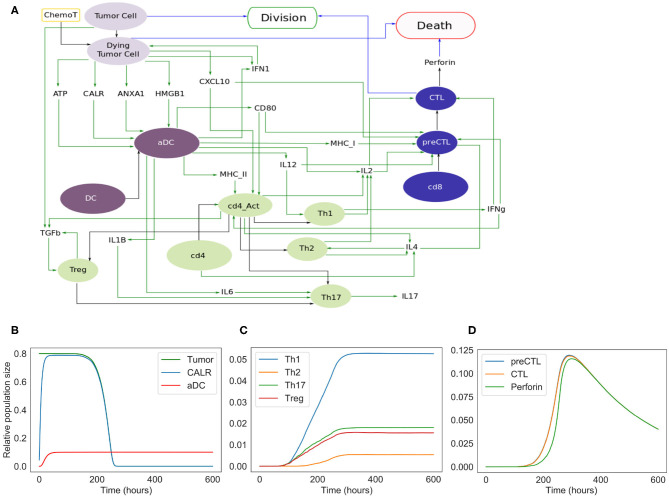
Figure 3.
Extended model. (A) Influence network of the extended version of ICD involving four cell types: tumor cells (light purple nodes), dendritic cells (dark purple nodes), CD4+ T cells (green nodes) and CD8+ T cells (blue nodes). Green arcs correspond to activation, black arcs to cell transformation, and blue arcs to cell fate interactions. Tumor Cell, DC, cd4, and cd8 are inputs. When the fifth input, namely ChemoT, is active, we consider that cells have incorporated a chemotherapeutic drug. The two cell fates, Division and Death, are outputs of the model. (B) Kinetics of the populations of tumor and active dendritic cells, as well as of CALR surface exposure. (C) Kinetics of the helper and regulatory CD4+ T cell subpopulations. (D) Kinetics of the CD8+ T cell subpopulations.

