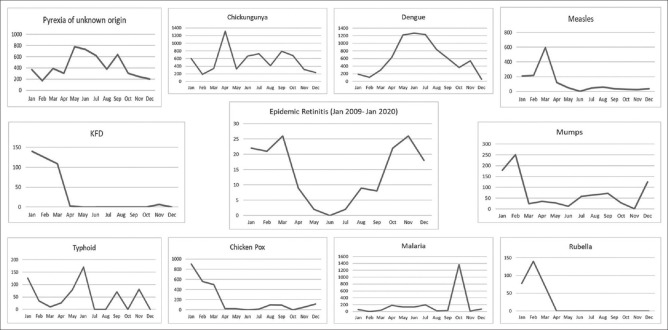
Figure 1.
A comparative month-wise graphical representation of individual systemic disease outbreaks as reported by IDSP from June 2009 to January 2020 against ER from June 2009 – January 2020. X-axis represents months and Y-axis total number of patients seen in that particular month for the entire study duration

