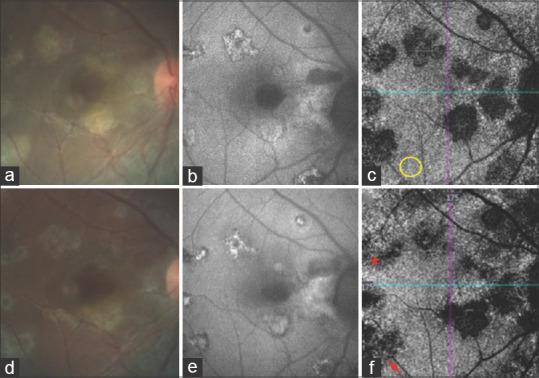
Figure 4.

(a) CF at first visit showing active SC. (b) Corresponding FAF image with lesions having hypoautofluorescent margins. (c) Corresponding OCTA of CCslab showing flow voids colocalizing with active areas on CF and FAF. Yellow circle is an area of normal flow. (d) CF at final visit showing the clinical resolution with flattening of lesions. (e) FAF image at final visit with lesions having hyperautofluorescent margins. (f) OCTA of CCslab at final visit showing a reduction in the size of flow void areas with the reemergence of choriocapillaris (asterisk) and the presence of large choroidal vessels at the base of few lesions (arrow)
