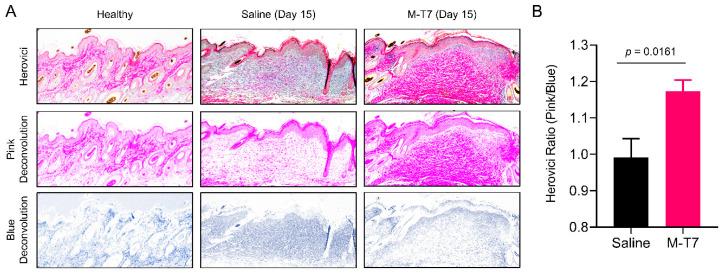
Figure 2.
Quantitative assessment of collagen maturation in wounds treated with M-T7. (A) Representative micrographs of Herovici’s polychrome-stained normal skin and wounds at 15 days post-wounding. Top panels show brightfield data, while middle and bottom panels show color-deconvoluted fields for the pink and blue chromophores. (B) Quantification of collagen maturation in saline and M-T7 treated wounds by the Herovici Ratio, calculated by the densitometric ratio of the pink and blue chromophores in Herovici’s polychrome. Mean and standard error are shown. Statistics were calculated by T-test. N = 4 saline, N = 5 M-T7.

