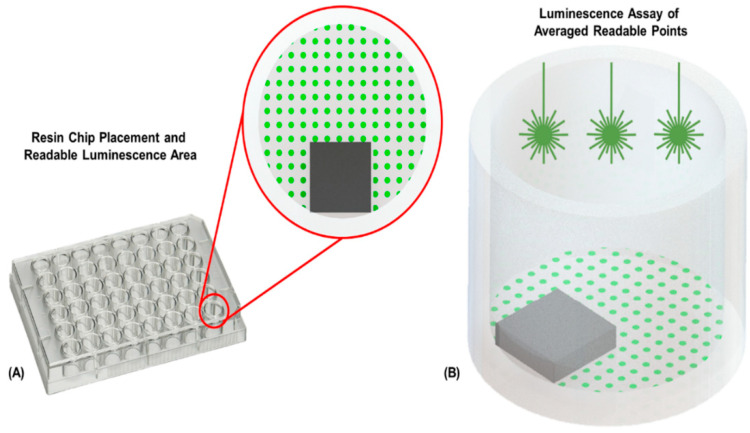
Figure 2.
Luminescence assay. (A) Image of a 48-well plate with schematic close-up demonstrating the placement and relative size of the resin chips in the wells. The grid of green dots represents the sampling points of the luminescence assay. (B) Schematic view of the luminescence assay process, illustrating the averaged luminescence leading to an output of percent viability. The stars illustrate the source light hitting the surface of the liquid in the culture well.

