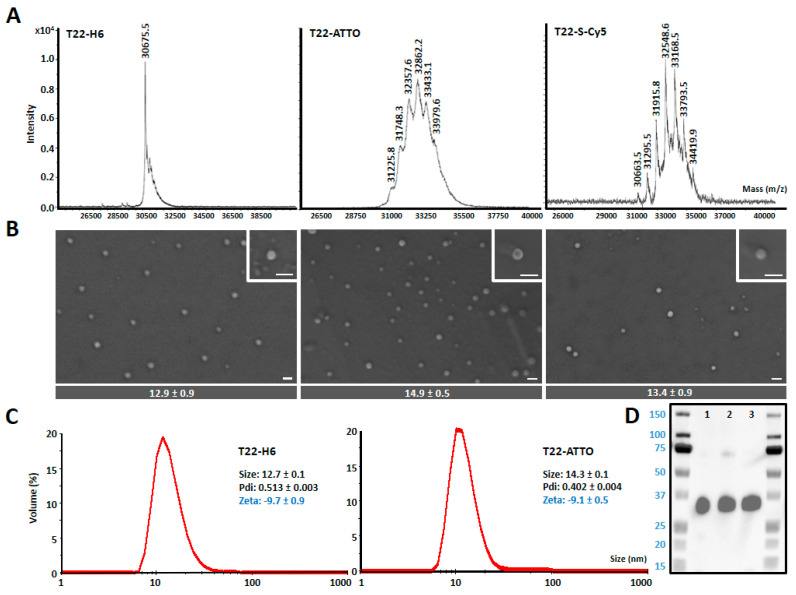
Figure 2.
Nanoarchitecture of nanoconstructs. (A) MALDI-TOF mass spectrometry of T22-GFP-H6 (T22) nanoparticles and T22-GFP-H6-ATTO (T22-ATTO) and T22-GFP-H6-S-Cy5 (T22-S-Cy5) nanoconjugates. Each peak over 30.6 kDa (T22-GFP-H6) corresponds to the addition of a single ATTO488 or Sulfo-Cy5 molecule, respectively. (B) Representative electron microscopy (FESEM) images of the three nanoconstructs (nanoparticles and nanoconjugates) presented in two magnifications (see insets), equivalent in all images. Scale bars indicate 30 nm. At the bottom, quantitative average size of nanoconstructs is determined by image analysis and shown as mean ± standard error. (C) Volume size distribution (Size) and Z-potential (Zeta) of protein nanoparticles measured by light scattering. T22-GFP-H6-S-Cy5 sample cannot be analyzed since S-Cy5 fluorescence interferes with light scattering measurements. Pdi indicates polydispersion index. (D) Western blot analysis of T22-GFP-H6 (1), T22-GFP-H6-S-Cy5 (2) and T22-GFP-H6-ATTO (3) immunodetected by an anti-GFP monoclonal antibody.

