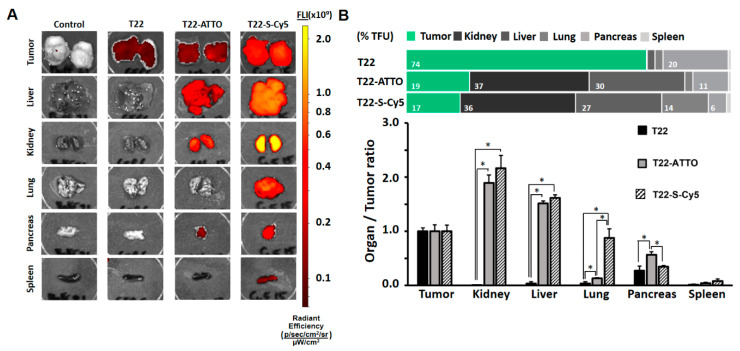
Figure 4.
Biodistribution in subcutaneous DLBCL mouse model. (A) Images of tumor and non-target organ sections of DLBCL mouse model at 5 h upon administration of buffer (Control), T22-GFP-H6 (T22) nanoparticles or labeled T22-GFP-H6-ATTO (T22-ATTO) and T22-GFP-H6-S-Cy5 (T22-S-Cy5) nanoconjugates monitored by IVIS spectrum and displayed as pseudocolor overlay expressing radiant efficiency. T22-GFP-H6 was excited at 450–480 nm and recorded at 510–530 nm bandpass; T22-GFP-H6-ATTO was excited at 485–515 nm and monitored at 530–550 nm bandpass, and T22-GFP-H6-S-Cy5 was excited at 625–655 nm and monitored at 690–710 nm bandpass. (B) Relative tissue accumulation of nanoparticles at 5 h post-administration expressed as organ to tumor ratio. Upper horizontal bars represent percentages of total fluorescence uptake (% TFU) in different organs. All data are presented as mean ± standard error. Significant differences at p < 0.05 are indicated as *.

