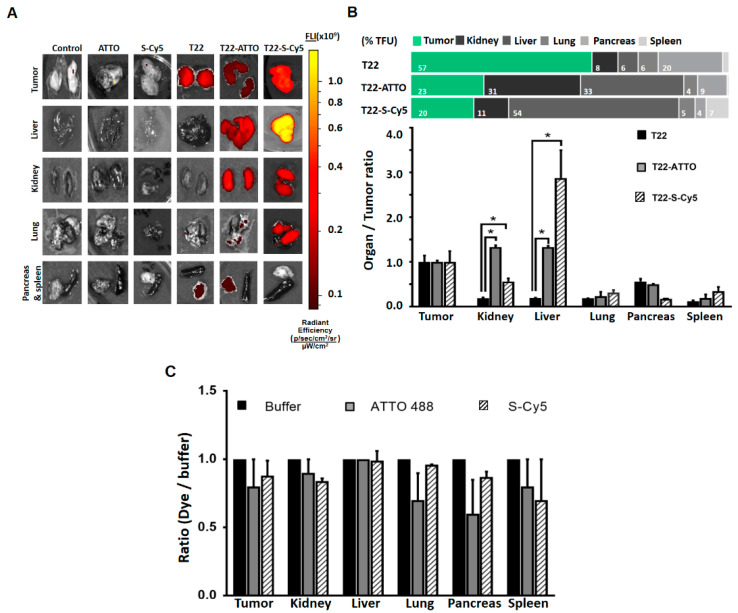
Figure 5.
Biodistribution in colorectal cancer model. (A) Images of tumor and non-target organ sections of colorectal cancer mouse model at 5 h upon administration of buffer (Control), free ATTO488 (ATTO) and Sulfo-Cy5 (S-Cy5), T22-GFP-H6 (T22) nanoparticles or labeled T22-GFP-H6-ATTO (T22-ATTO) and T22-GFP-H6-S-Cy5 (T22-S-Cy5) nanoconjugates, monitored by the IVIS spectrum and displayed as pseudocolor overlay expressing radiant efficiency. T22-GFP-H6 was excited at 450–480 nm and recorded at 510–530 nm bandpass; T22-GFP-H6-ATTO was excited at 485–515 nm and monitored at 530–550 nm bandpass, and T22-GFP-H6-S-Cy5 was excited at 625–655 nm and monitored at 690–710 nm bandpass. (B) Relative tissue accumulation of nanoparticles expressed as organ to tumor ratio. Upper horizontal bars represent the percentages of total fluorescence uptake (% TFU) in different organs (C) Free ATTO488 (ATTO) and Sulfo-Cy5 (S-Cy5) tissue accumulation upon 5 h of administration expressed as fluorochrome to buffer ratio. All data are presented as mean ± standard error. Significant differences at p < 0.05 are indicated as *.

