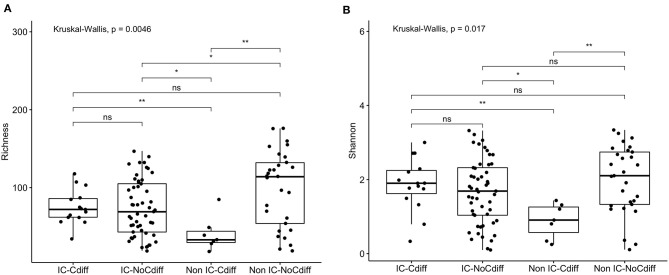
Figure 5.
Comparison of (A) species richness (OTU count) and (B) diversity (Shannon index) comparing the IC and non-IC groups based on C. difficile colonization. Each point represents an individual patient and the boxplot shows the median, the first and third quartiles (bottom and top bars of the boxplot) and minimum and maximum values. **p < 0.01, *p < 0.05, ns, not significant; Wilcoxon rank sum test.

