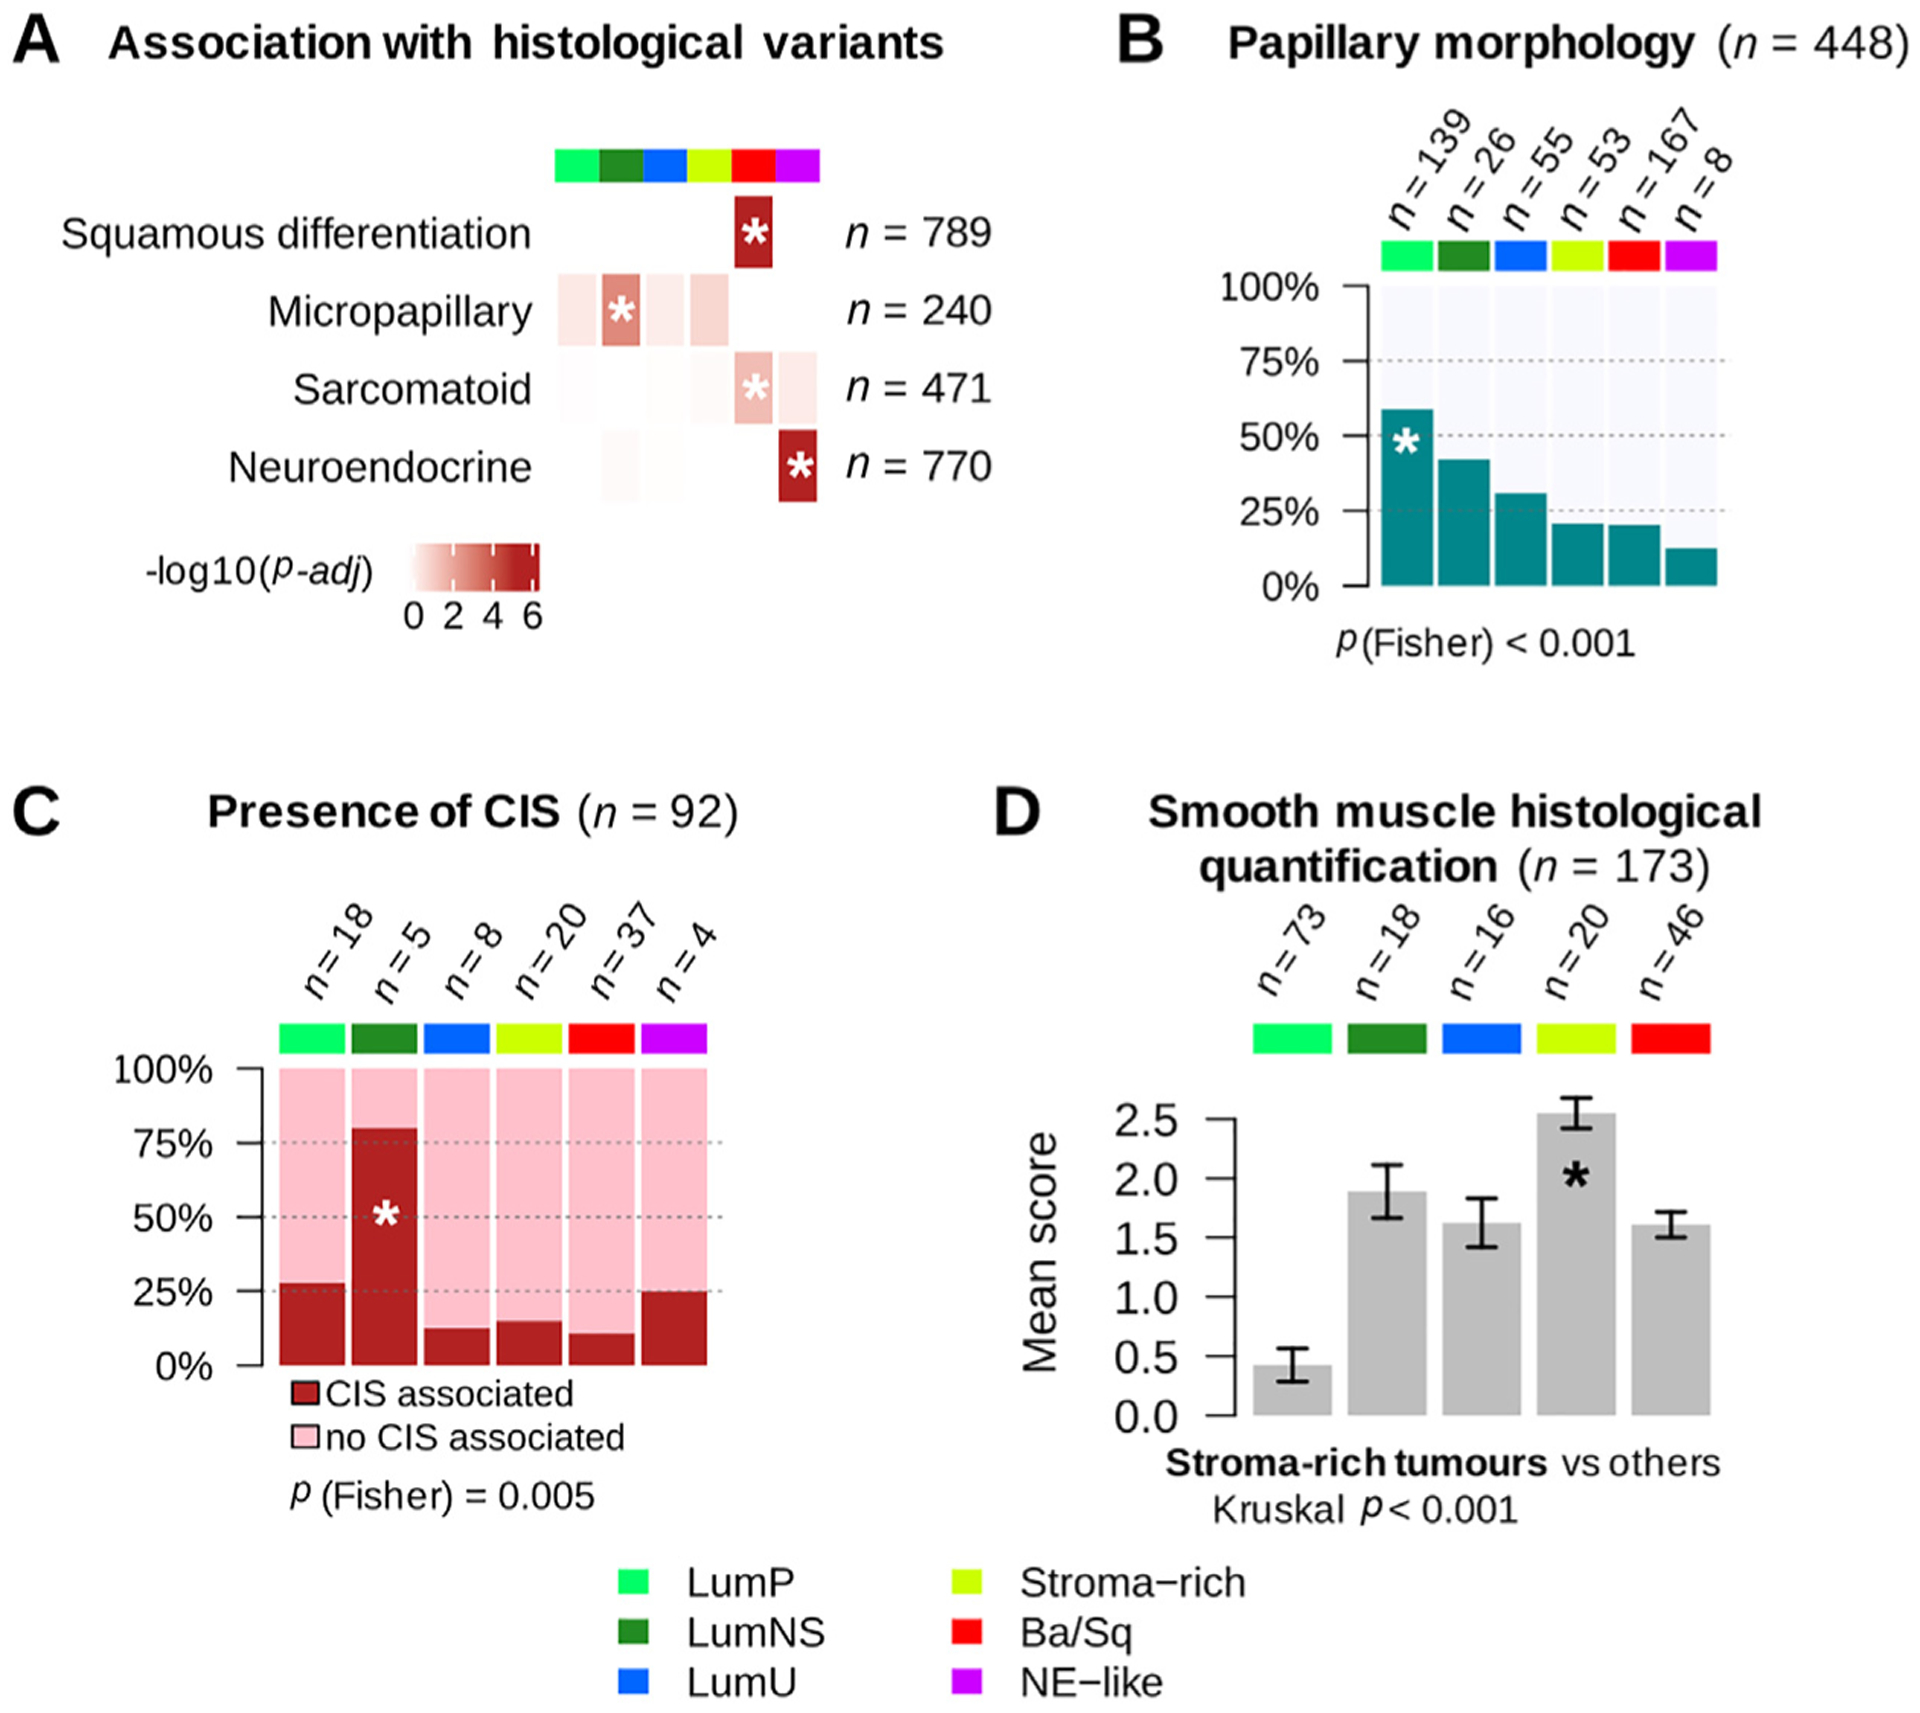
Fig. 4 –

Histopathological associations with consensus classes. (A) Histological variant over-representation within each consensus class. One-sided Fisher exact tests were performed for each class and histological pattern; asterisks indicate a significant association between a consensus class and a histological feature (p < 0.05). Pathological review of histological variants was available for several cohorts: squamous differentiation was evaluated in CIT (n = 75), MDA (n = 46), Sjödahl2012 (n = 23), Sjödahl2017 (n = 239), and TCGA (n = 406) cohorts; neuroendocrine variants were reviewed in CIT (n = 75), MDA (n = 46), Sjödahl2017 (n = 243), and TCGA (n = 406) cohorts; micropapillary variants were reviewed in CIT (n = 75), MDA (n = 46), and TCGA cohorts (n = 118 FFPE tumor slides from TCGA were reviewed by Y.A. and J.F. for this study). Results are displayed on the heatmap as −log10(adj Fisher’s p). Detailed sample counts within each class are given in Supplementary Fig. 4. (B) Occurrence of papillary morphology in tumors from the TCGA cohort (n = 401) and the CIT cohort (n = 47). (C) Proportion of samples with associated CIS within each consensus class in tumors from the CIT cohort (n = 84) and the Dyrskjøt cohort (n = 8). (D) Smooth muscle infiltration from images for 173 tumor slides from the TCGA cohort. Each sample was assigned a semiquantitative score ranging from 0 to 3 (0 = absent, 1 = low, 2 = moderate, and 3 = high) to quantify the presence of large smooth muscle bundles. The bar plot shows means and standard errors for each class.
Ba/Sq = basal/squamous; CIS = carcinoma in situ; CIT = Cartes d’Identité des Tumeurs; FFPE = formalin-fixed paraffin-embedded; LumNS = luminal nonspecified; LumP = luminal papillary; LumU = luminal unstable; MDA = MD Anderson Cancer Center; NE = neuroendocrine; TCGA = the Cancer Genome Atlas.
