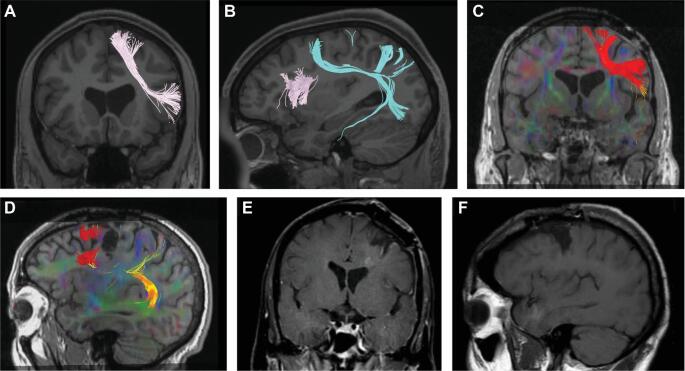
FIGURE 3.
A and B, Diffusion tensor imaging (DTI) of a healthy control, showing Frontal aslant tracts (FAT) in pink and tracts arising from area 55b in coronal A and saggital B cuts. C and D, DTI of the patient prior to onset of AOS, showing FAT tracts in red and area 55b tracts in yellow/orange, in coronal C and saggital D cuts. E and F, T1-weighted MRI of the patient after the resection leading to AOS in coronal E and saggital F cuts.

