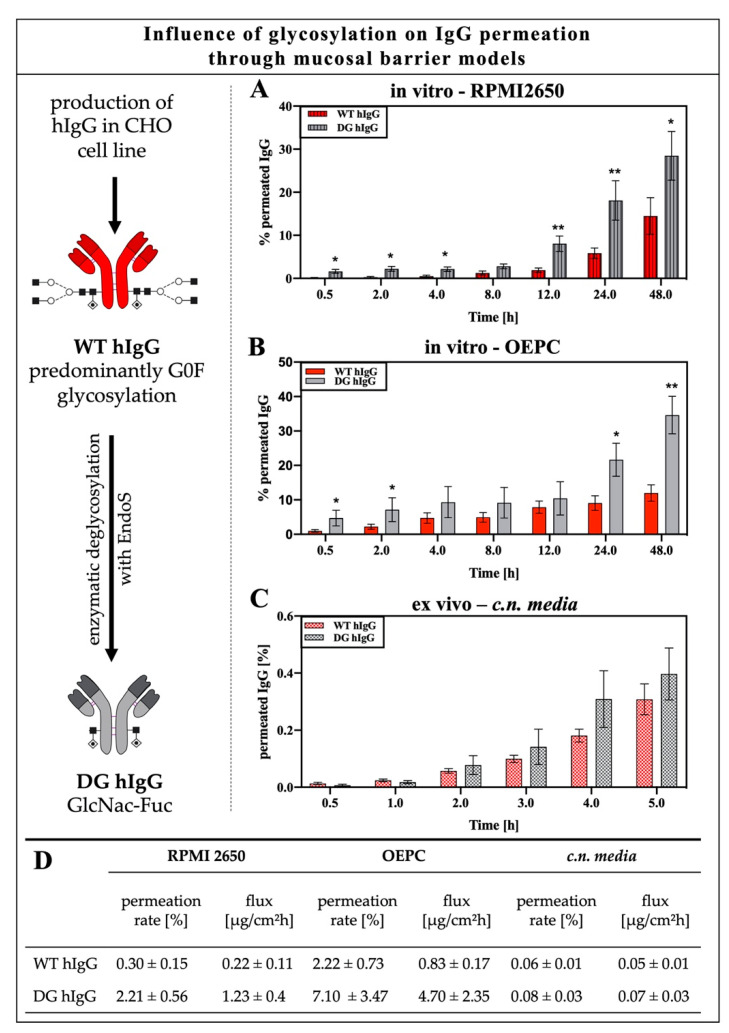
Figure 3.
Permeation of wild-type (WT hIgG) and deglycosylated human IgG (DG hIgG) through RPMI 2650, porcine olfactory epithelial primary cells (OEPC) and porcine olfactory mucosa (c.n.media) (A) Percentage permeation of WT hIgG and DG hIgG through RPMI 2650 cells over 48 h. Error bars represent mean ± SEM. N = 3, n = 11. (B) Percentage permeation of WT hIgG and DG hIgG through olfactory epithelial primary cells (OEPC) in vitro model over 48 h. Error bars represent mean ± SEM. WT hIgG: N = 4, n = 21, DG hIgG: N = 3, n = 10. (C) Percentage permeation of WT hIgG and DG hIgG through excised nasal mucosa tissue explants (ex vivo) over 5 h. Error bars represent mean ± SEM. WT hIgG: N = 4, n = 29, DG hIgG: N = 3, n = 10. (D) Tabular summary of permeation rate and flux of WT and DG hIgG in the in vitro models RPMI 2650 and OEPC and the ex vivo model c.n media after 2 h. Results represent mean values ± SEM. Permeation of wild-type (WT hIgG) and Endo S digested deglycosylated human IgG (DG hIgG) through porcine olfactory epithelial primary cells and porcine olfactory mucosa. Both in vitro models show significant differences (p < 0.001) in permeation rate and flux compared to the ex vivo model. Furthermore, the permeation through the OEPC model resulted in significantly higher permeation and flux compared to the RPMI 2650 model (p < 0.001). The significance was calculated by unpaired t-test. * p < 0.05, ** p < 0.001, error bars represent mean ± SEM.

