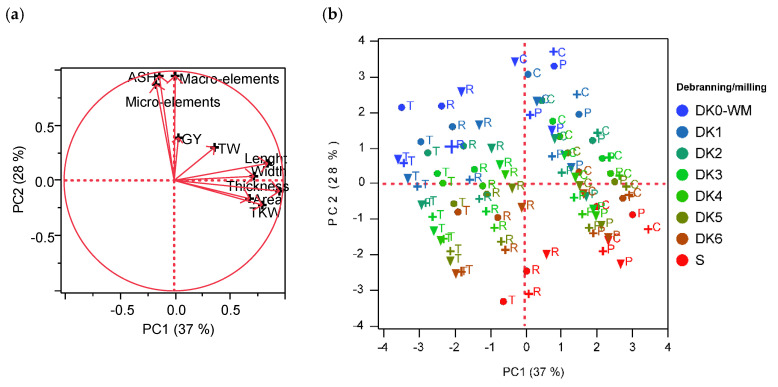
Figure 2.
PCA loading plot showing the distribution of the analyzed variables (a) and score plot (b) showing the distribution of old genotypes (C = Cappelli, P = Perciasacchi, R = Russello, T = Timilia), grown in the three environments (● Palermo, + Foggia, ▼ Agrigento) during processing (milling/debranning from blue to red: DK0-WM (wholemeal), DK1, DK2, DK3, DK4, DK5, DK6, S (semolina)) along the two principal factors. (For interpretation of the references to color in this figure legend, the reader is referred to the web version of this article). Macro-elements = sum of Na, K, P, Ca, and Mg; micro-elements = sum of Mn, Fe, Cu, Zn and Mo; GY = grain yield; TW = Test Weight; TKW = Thousand kernel weight; PCA = Principal component analysis.

