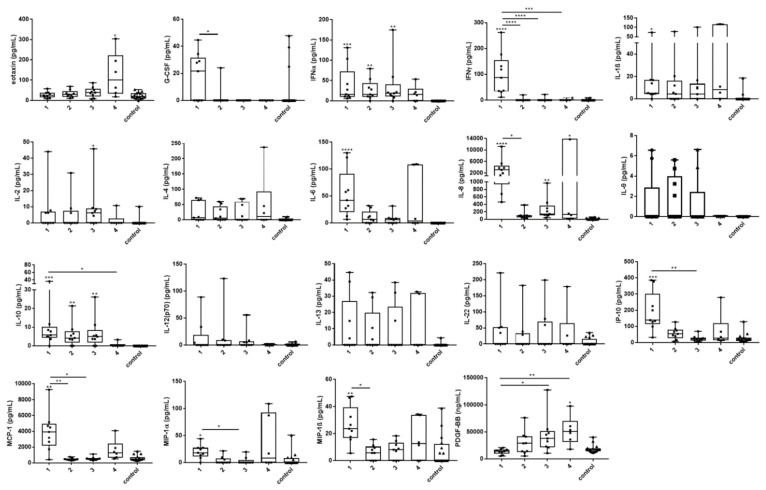
Figure 2.
Changes of serum cytokine and chemokine levels in acute tularemia cases over time. Sera from nine patients diagnosed with acute tularemia and 16 sera from healthy blood donors (controls) were analyzed by bead-based LegendPlex assay. Time sampling points are shown on the X axis (1 – 3 represent 1, 2, and 3 weeks after exposure; 4 represents 21 weeks after exposure). For sampling points 1–3, sera from all nine patients for whom antibody testing was performed were available. For sampling time point 4, only sera from six patients were available. In comparison to the healthy controls and/or between different time points, significant changes of eotaxin, G-CSF, IFNα, IFNγ, IL-1β, IL-2, IL-6, IL-8, IL-10, IP-10, MCP-1, MIP-1α, MIP-1β, and PDGF-BB were demonstrated in the tularemia patients. Non-significant but marked changes were seen for IL-4, IL-9, IL-12, IL-13, and IL-22. Many mediators peaked at the first sampling time point, whereas peaks at sampling time point 4 were caused by patients 3, 6, and 7. Patients 4 and 7 showed the highest cytokine and chemokine responses throughout. For comparison between the analyzed groups, the Kruskal–Wallis test with subsequent Dunn’s multiple comparisons test was used. Data are expressed as box-and-whisker plots showing median, upper and lower quartile, minimum, and maximum values. Asterisks indicate statistically significant differences (* p < 0.05, ** p < 0.01, *** p < 0.001, **** p < 0.0001). Asterisks with bars represent comparisons between the respective time sampling points. Asterisks without bars represent the comparison of individual time sampling points versus the control group. Serum concentrations of FGF-basic, GM-CSF, IL-5, IL-17A, IL-17F, IL-21, RANTES, TNFα, and VEGF were similar in the patients and the controls. Generally, most cytokine and chemokine levels peaked in the first week after exposure, followed by normalization over the next weeks. Of note, some cytokines and chemokines peaked at blood sampling time point 4 instead (eotaxin, IL-4, PDGF), or showed a second peak at time point 4 (IL-1β, IP-10, MCP-1, MIP-1α, MIP-1β). This second peak seen in the patient cohort 21 weeks after exposure was mainly due to elevations of these cytokines in patients 3, 6, and 7. Patients 4 and 7 showed the highest concentrations for most cytokines and chemokines tested at the first three sampling points (high responders). In contrast, patient 9 who seroconverted later than three weeks post exposure showed generally the lowest cytokine and chemokine concentrations throughout the observation period (low responder).

