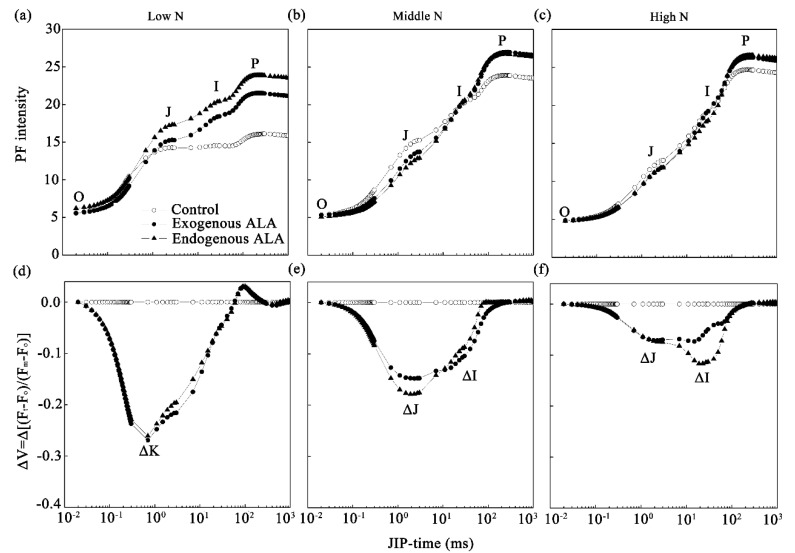
Figure 3.
Changes in prompt fluorescence (PF) curves in exogenously-treated and endogenous ALA-overproducing canola leaves under low- (a,d), middle- (b,e), and high-N conditions (c,f). (a–c) PF curves plotted on a logarithmic time scale from 20 μs to 1 s (JIP time). The steps O (at 20 µs), J (at 2 ms), I (at 30 ms), and P (peak) are marked. Each curve is the average of 10 replicate measurements. (d–f) Variable fluorescence curves (ΔV = Δ[(Ft − Fo)/(Fm − Fo)]), which were constructed by subtracting the normalized (between the O step and P step) values of the PF recorded in wild-type (WT) canola. The feature peaks ΔK, ΔJ, and ΔI are marked.

