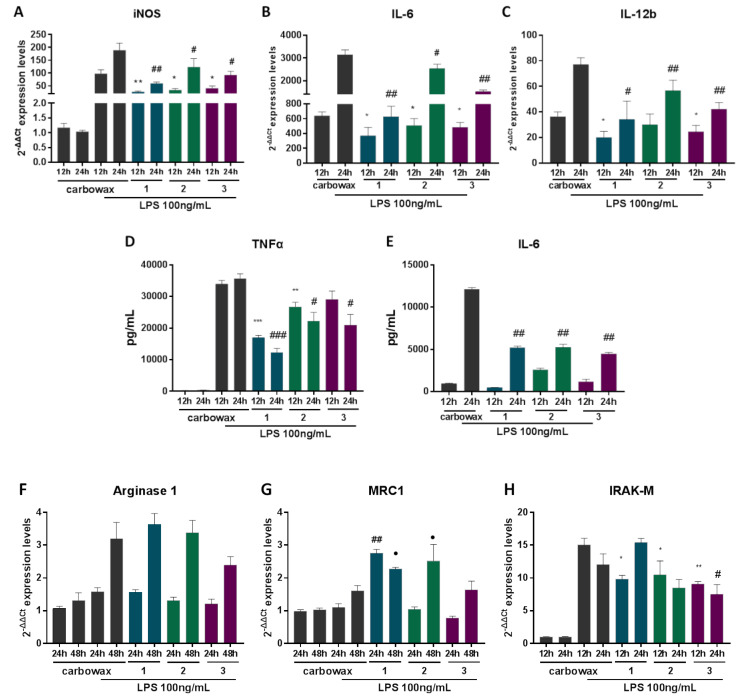
Figure 4.
The effect of metabolites 1–3 on the expression of inflammatory genes in RAW 264.7 macrophages post LPS stimulation for 12, 24 and 48 h and simultaneous incubation with the respective disulfide. Pro-inflammatory markers (A) iNOS, (B) IL-6, (C) IL-12 mRNA expression levels were measured using real time PCR. (D) TNFα and (E) IL-6 production was determined using ELISA in cell culture supernatant. Markers of M2 macrophages (F) Arginase 1, (G) MRC1 and (H) IRAK-M expression levels were determined using real time PCR. All treatments have been compared to carbowax 400 0.1% v/v + 0.01% ethanol treated cells in each time point indicated. Disulfide concentration used for 1 and 2 treatments was 15.62 μΜ and for 3 it was 31.25 μΜ. Statistical analysis was carried out using a Mann–Whitney unpaired t-test in Graphpad Prism 7.0 and graphs represent mean ± SEM (* indicates p < 0.05, ** indicates p < 0.01, *** indicates p < 0.001 compared to carbowax 12 h, # indicates p < 0.05, ## indicates p < 0.01, ### indicates p < 0.001 compared to carbowax 24 h, ● indicates p < 0.05, ●● indicates p < 0.01, ●●● indicates p < 0.001 compared to carbowax 48 h).

