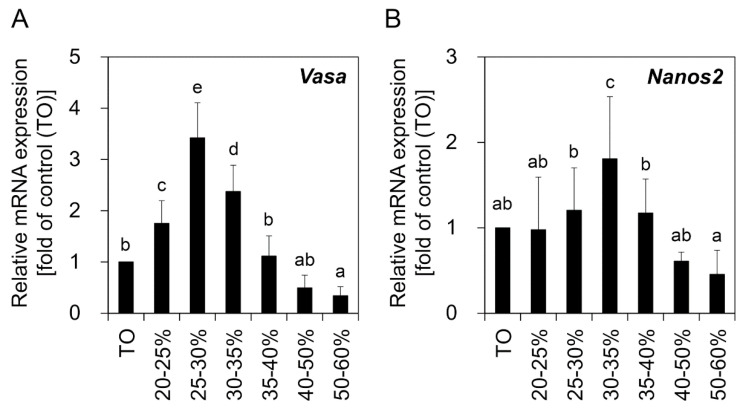
Figure 2.
Relative expression of Vasa and Nanos2 genes in the ovary-derived cell populations separated by PDGC. Crude TO was harvested by enzymatic dissociation of the ovaries derived from 10 adult females. Following PDGC, cells from each density fraction were subjected to qRT-PCR analysis for comparison of Vasa (A) and Nanos2 (B) expression levels. TO was used as a control. Significant increases in Vasa expression were observed in the cells from the 20–35% density fractions. For Nanos2, the highest expression level was observed in cells from the 30–35% density fraction. The values are expressed as mean ±SD. a–e Different letters indicate significant differences; p < 0.05.

