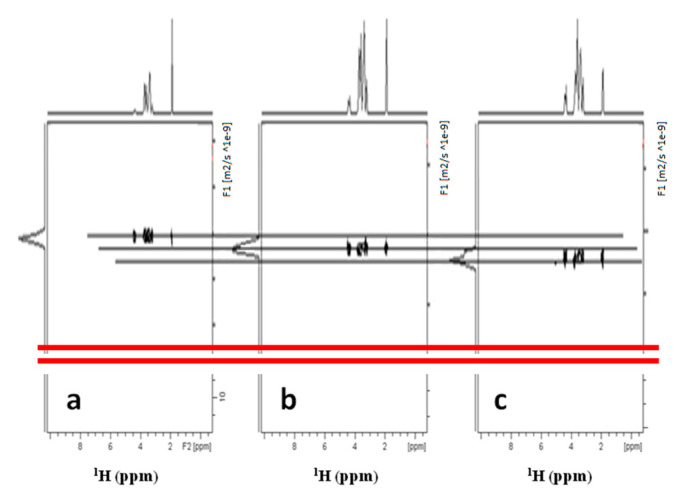
Figure 4.
DOSY experiments of three different HA polymer standards in D2O with different MWs. (a) 13 kDa; (b) 50 kDa; (c) 208 kDa. To avoid confusion due to possible interferences, the experiments were run on single polymer samples. The diffusion coefficient obtained are used for the calibration curve in the log-log plot of the Figure 5.

