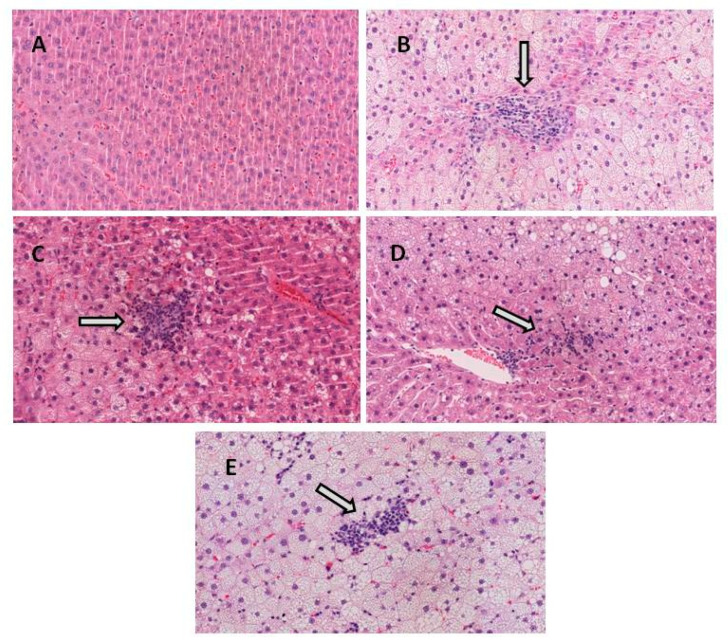
Figure 1.
Representative H&E stained histological liver samples (magnification ×20). (A) healthy liver from CC group, (B) liver from HFHF group showing moderate inflammation and ballooning degeneration, (C) liver from PT15 group showing moderate inflammation and ballooning degeneration, (D) liver from PT30 group showing mild inflammation and ballooning degeneration and (E) liver from RSV30 group showing mild–moderate inflammation and ballooning degeneration. White arrows indicate inflammation.

