Figure 5.
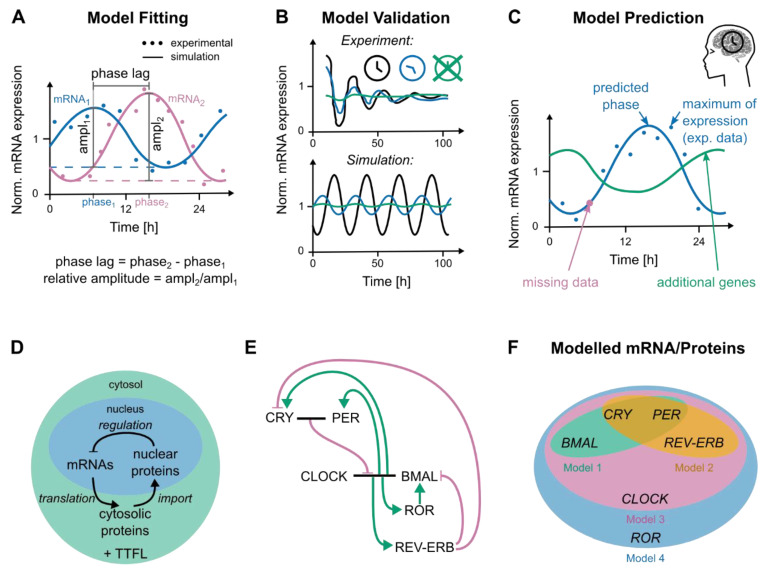
Basic mechanisms of genetic core-clock models. (A) Adapting the parameters of the model, the simulated model (blue and pink lines) can be fitted to experimental or clinical data (blue and pink dots). (B) After fitting, the model is validated by predicting, for example, whether or not oscillations are observed for known knock-out scenarios. (C) The model can be used to directly predict the circadian phenotype or to derive features for a subsequent prediction, such as additional data points or unobserved data. (D) The negative feedback loop in the circadian clock is based on an mRNA, which, translated to a cytosolic protein, is imported to the nucleus, where the nuclear protein inhibits the subsequent transcription of its target mRNA. (E) The basic interactions between different genes in the core-clock network. Each node represents a simplification of the translation/importing steps depicted in D. Green lines represent activation reactions, pink lines inhibitions and black lines complex formation. (F) Published molecular models of the core-clock implement different sets of core-clock genes. Models were selected for mammalian parameters and a focus on core-clock gene dynamics. Model 1, Becker-Weimann et al. 2004 [190]; Model 2, Forger et al. 2003 [189]; Model 3, Leloup et al. 2003 [188]; Model 4, Mirsky et al. 2009 [191]; Relógio et al. 2011 [23].

