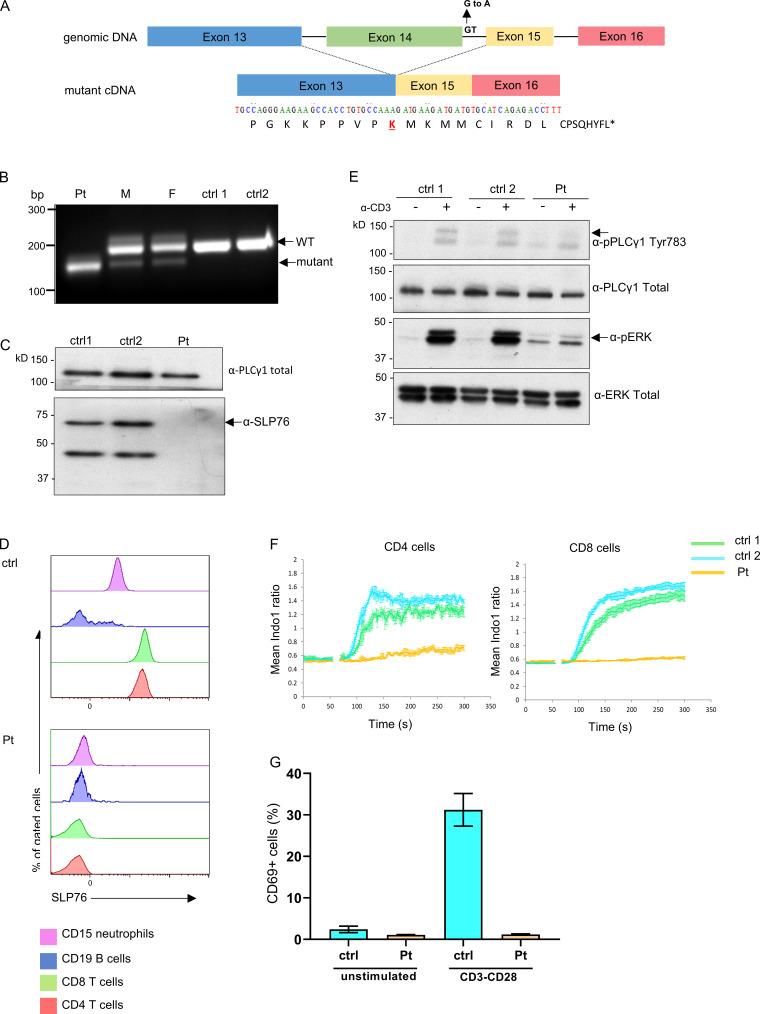
Figure 2.
Genetic, cellular, and functional characterization of SLP76 mutation. (A) Top: Schematic presentation of genomic DNA of SLP76 where the splice site mutation at the beginning of intron 14 is shown. Bottom: The mutated form of the cDNA is presented, where the skipping of exon 14 results in a putative frame shift after lysine (K) 309 of SLP76 (marked in red). The putative 17 amino acids and premature termination codon (asterisk) of the shifted sequence are shown. (B) PCR was performed on cDNA obtained from the patient, his parents, and two healthy controls (ctrl) using primers from exons 13 and 16 of SLP76. A single smaller fragment (190 bp), which suggests an exon skipping due to the splice mutation, is seen in the patient’s cells compared with a single higher band (221 bp) in the anticipated length in the healthy controls. The mother (M) and father (F) show both bands, as can be expected with the two being heterozygote carriers to the mutation. One representative gel out of three is shown. (C) Western blot analysis of SLP76 expression in expanded T cell lymphoblasts from the patient and two age-matched healthy controls. Total PLC-γ1 expression serves as a control for protein loading. One representative blot out of three is shown. (D) Flow-cytometric analysis determines the expression of SLP76 in T cells (CD4 and CD8), B cells (CD20), and neutrophils (CD15) from healthy control (top) and the patient (bottom). One representative experiment out of three is shown. (E) Western blot analysis of phosphorylated PLC-γ1 and phosphorylated ERK1/2 with (+) or without (−) stimulation with anti-CD3 in expanded T cell lymphoblasts from the patient and two age-matched healthy controls. Total PLC-γ1 and total ERK1/2 were used as a loading control for the patient and two age-matched healthy controls, respectively. One representative blot out of two is shown. (F) Expanded T cell lymphoblasts from the patient and two age-matched healthy controls were barcoded, mixed together, loaded with indo-1-AM, and stained for CD4 and CD8. Intracellular Ca2+ concentration was measured using flow cytometry at 37°C, with cross-linked anti-CD3 added at the 60-s time point. Mean ratiometric Ca2+ measurements are presented separately for the CD4+ (left) and CD8+ (right) populations. Results are the average of three replicates, with error bars indicating the SD. One representative experiment out of two is shown. (G) PBMCs from the patient and healthy age-matched controls were either stimulated with anti-CD3/CD28 or left unstimulated. CD69 expression was measured using flow cytometry and the results of three different analyses are summarized in the graph. Statistical analysis was performed using unpaired one-tailed t tests.

