Figure 3.
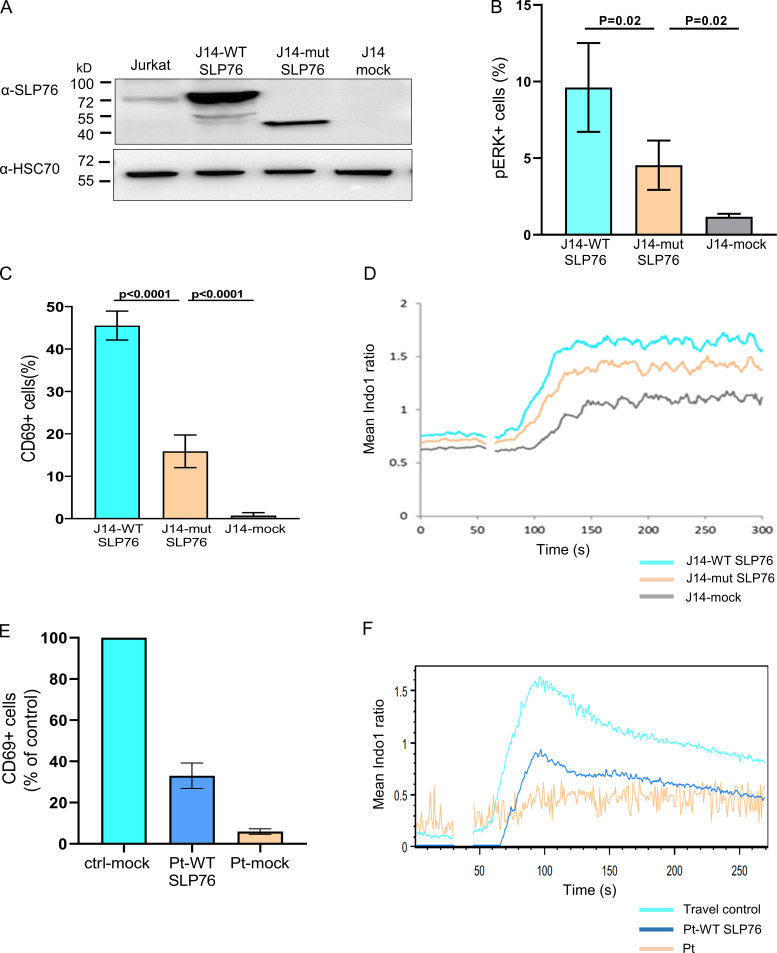
Modeling and correction of the SLP76 mutant phenotype. SLP76-deficient Jurkat-derived human leukemic T cell line (J14) retrovirally transduced with the WT or mutant form of SLP76 or with the empty mock vector. (A) Western blot analysis to determine SLP76 expression. The truncated SLP76 is expected to be 37 kD. The expression of SLP76 in the common Jurkat cell line serves as a reference control, and HSC70 was used as a loading control. One representative blot out of three is shown. (B) Phosphorylated ERK1/2 was measured using flow cytometry in either anti-TCR (C305) stimulated cells or unstimulated cells. The analysis was done only on transduced cells by gating on GFP+ cells. The results of three different analyses are summarized in the graph. Statistical analysis was performed using unpaired one-tailed t tests. (C) CD69 expression was measured using flow cytometry in either anti-TCR (C305) stimulated cells or unstimulated cells. The analysis was done only on transduced cells by gating on GFP+ cells. The results of four different analyses are summarized in the graph. Statistical analysis was performed using unpaired one-tailed t tests. (D) Reconstituted J14 cells were barcoded, mixed together, and loaded with indo-1-AM. Shown is the mean ratiometric Ca2+ measurement, with anti-TCR (C305) added at the 60-s time point. Results are the average of three replicates. One representative experiment out of two is shown. (E) Expanded T cell lymphoblasts from the patient were retrovirally transduced with either WT SLP76 or empty mock vector tagged with GFP. Expanded T cell lymphoblasts from two-age matched healthy controls were retrovirally transduced with empty mock vector tagged with GFP. Both cells from the patient and controls were either stimulated with anti-CD3/CD28 or left unstimulated, and CD69 expression was measured on GFP+ cells using flow cytometry. The result of CD69 expression in the patient’s cells that were reconstituted with WT SLP76 is shown as a percentage from healthy control (ctrl-mock), where the healthy control is set for 100%. For the control, each bar represents the average of three experiments, and for the patient, the bars represent data from two experiments, which include four independent samples. Statistical analyses were performed using unpaired one-tailed t test. (F) WT SLP76–transfected patient T cells, patient T cells, and travel control T cells were loaded with indo-1-AM. Ca2+ influx in response to anti-CD3 stimulation was determined by the ratio of the fluorescent signals at 405 nm (Ca2+-bound dye) to 485 nm (Ca2+-free dye) over time via flow cytometry. The experiment was performed once.

