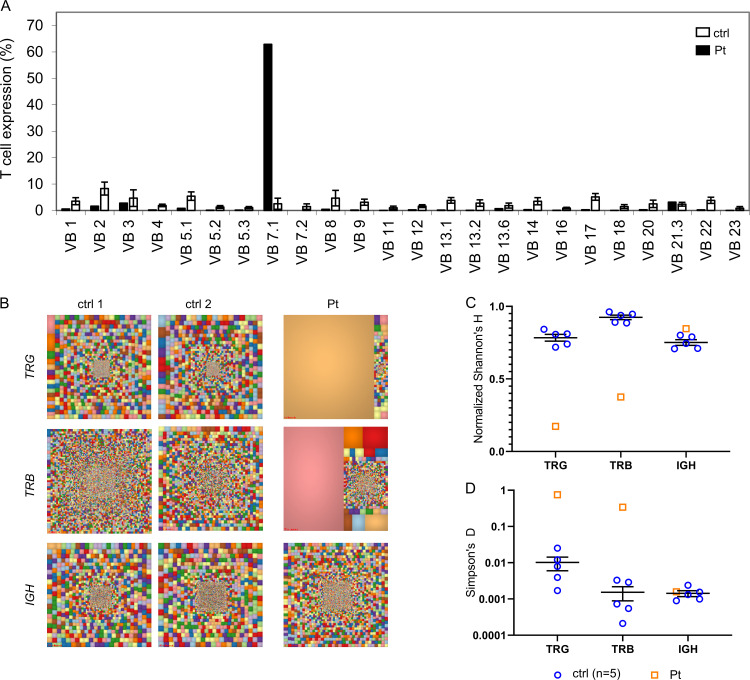
Figure 4.
Immune repertoire determined by next-generation sequencing for the SLP76-mutated patient. (A) Flow cytometry analysis of surface membrane expression of 24 different TRB variable gene families in the patient’s CD3 cells (black bars) compared with healthy controls (ctrl; white bars, n = 85, provided by the kit). One representative result out of two is shown. (B) Treemap representation of TRG, TRB, and B cell receptor (IGH) repertoire in PBMCs from the patient and two age-matched healthy controls. Each square represents a unique V to J joining, and the size of the square represents relative frequency within that sample. Two representative controls out of four are shown. (C and D) Quantification of the diversity and unevenness of the TRG, TRB, and IGH repertoire using the Shannon’s H index of diversity (C) and the Simpson’s D index of unevenness (D) in five healthy controls and in the SLP76-mutated patient.

