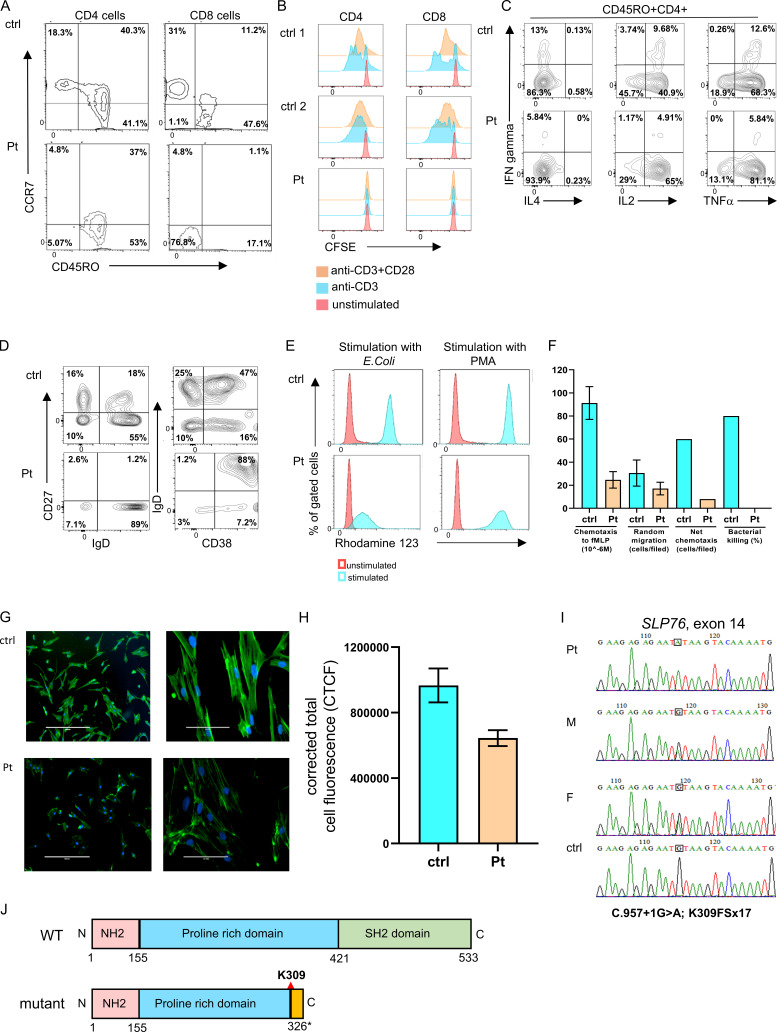
Figure S1.
Immune phenotype and genetic characterization of the SLP76-deficient patient. (A) Immunophenotyping of patient’s CD4 and CD8 cells measured by flow cytometry. The CD4 cells have a central memory phenotype (CCR7+CD45RO+; left), and the CD8 cells have a TEMRA phenotype (CCR7−CD45RO−; right) compared with age-matched healthy control (ctrl). The experiment was performed once. (B) T cell proliferation: T cell proliferation using CFSE fluorescence cell incorporation assay 4 d after stimulation with anti-CD3 or anti-CD3/CD28. These data show reduced proliferation in the patient CD4 and CD8 cells compared with the two healthy controls. The experiment was performed once. (C) Flow cytometric analysis of cytokine response: Expanded T cells lymphoblasts were stimulated with plate-bound OKT3 (10 μg/ml) and soluble CD28 (2 μg/ml) for 12 h., then 20 ng/ml PMA and 1 μmol/liter ionomycin in the presence of brefeldin A for 5 h. IFN-γ, IL-4, IL-2, and TNFα production among CD45RO+CD4+ cells was assessed via flow cytometry. One representative experiment out of two is shown. (D) Peripheral B cell immunophenotyping:B cell immunophenotyping measured by flow cytometry revealed decreased frequencies of naive (CD27−IgD+) and class-switched (CD27+IgD−) B cells, along with elevated immature B cells (CD38+IgD+) in the patient pheripheral blood lymphocytes compared with control. One representative experiment out of two is shown. (E) Neutrophils oxidative burst: Dihydrorhodamine assay was performed in peripheral blood from the patient and age-matched healthy controls after stimulation with E. coli bacteria or PMA using flow cytometry. One representative experiment out of four is presented. (F) Neutrophils function: Neutrophil chemotaxis, random migration, net chemotaxis, and bacterial killing were markedly reduced in the patient’s neutrophils compared with age-matched healthy controls. For the chemotaxis and random migration experiments, each bar represents the average of two experiments, and for the net chemotaxis and bacterial killing assays, the bars represent data from one experiment. Statistical analyses were performed using unpaired one-tailed t test. (G) Fluorescence studies of actin polymerization: The actin polymerization in fibroblasts from the patient and control was determined using phalloidin staining. Fluorescent microscopy images of FITC phalloidin staining demonstrate clear fluorescence attenuation in the patient’s cells compared with control. Phalloidin stains green and the nuclei (DAPI) stain blue. Images of ×10 magnification (left) and ×40 magnification (right) are shown. One representative experiment out of three is shown. (H) Quantification of the corrected total cell fluorescence (CTCF) in the patient and control fibroblasts using ImageJ software. Results are the average of three replicates, with error bars indicating the SD. (I) Genetic analysis of SLP76 mutation: Sanger sequencing confirmed the presence of a donor splice site mutation in the patient, which fully segregated with the parents (M, mother; F, father). The mutated nucleotide is boxed. A normal sequence of a healthy control is also presented. (J) SLP76 domains: Schematic representation of WT and mutant SLP76 protein domains. The splicing mutation causes a putative frame shift following lysine 309 (K309) in the central proline-rich domain (blue) and a premature stop codon 17 amino acids downstream of the mutation (yellow). This results in a deletion of the C-terminal SH2 domain (green).

