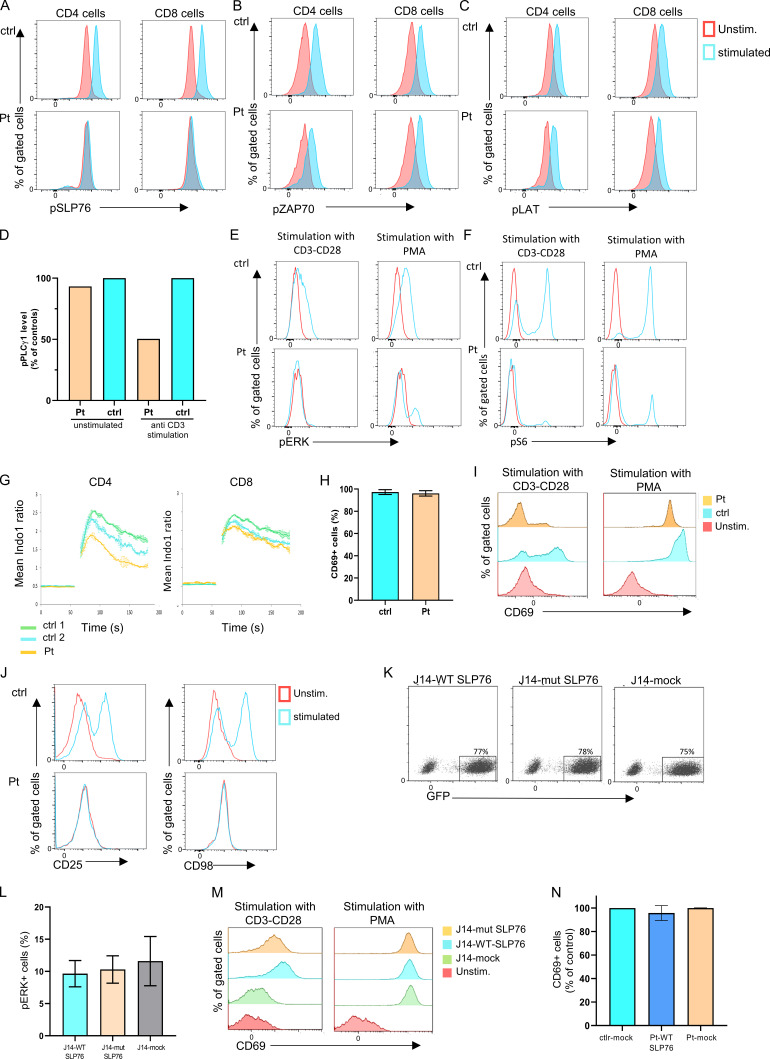
Figure S2.
The biologic effect on the TCR signaling due to the SLP76 mutation. (A-C) TCR-induced signaling in SLP76 mutated cells: Flow cytometry analyses of intracellular levels of phosphorylated SLP76 (A), phosphorylated ZAP-70 (B), and phosphorylated LAT (C) in unstimulated and stimulated peripheral CD4 and CD8 T cells from the patient and control are shown. No phosphorylation of SLP76 was detected in the patient's cells, and the phosphorylation of ZAP-70 and LAT was normal compared with control. One representative experiment out of two is shown. (D) Quantification of the level of phospho-PLC-γ1. The level of phospho-PLC-γ1 in the patient and control cells as presented in the Western blot (Fig. 2 E) was quantified by densitometry analysis using ImageJ software. The level of phospho-PLC-γ1 in the patient cells with or without anti-CD3 stimulation was calculated as the percentage from control. The bars for the control are the average of two controls (ctrl 1 and ctrl 2), and it is set to 100%. Reduction in the patient’s phospho-PLC-γ1 level was detected. (E and F) TCR signaling in SLP76-mutated T cells: Phosphorylation of pERK1/2 (E) and pS6 (F) in patient and control T cells, either without stimulation or after stimulation with anti-CD3/CD28 or with PMA, was measured using flow cytometry. Stimulation with anti-CD3/CD28 did not lead to phosphorylation in pERK1/2 and pS6 in the patient’s cells, while PMA stimulation led to a modestly improved response comparable to control. One representative experiment out of two is shown. (G) Ca2+ mobilization: Expanded T cell lymphoblasts from the patient and age-matched healthy controls were loaded with indo-1-AM. Ca2+ concentration was measured following stimulation with ionomycin. Ca2+ mobilization was determined in CD4 and CD8 T cells. Results are the average of two replicates, with error bars indicating the SD. One representative experiment out of two is shown. (H-J) Expression of surface activation markers. (H) PBMCs from the patient and age-matched healthy controls were stimulated with PMA. CD69 expression was measured using flow cytometry and the results of three different analyses are summarized in the graph (P value = NS). Statistical analysis was performed using unpaired one-tailed t tests. (I) The actual flow cytometry results of CD69 expression in unstimulated and stimulated PBMCs from the patient and control are presented. One representative experiment out of four is presented. (J) Flow cytometric expression of CD25 and CD98 in unstimulated and stimulated T cells from the patient and age-matched control reveals lack of upregulation of these markers in the patient cells compared with control. One representative experiment out of two is shown. (K) Flow cytometric analysis showing equal amounts of GFP+ cells in J14-transduced experiments. J14 cells were transduced with an IRES-GFP-tagged retroviral vector encoding FLAG-tagged WT or mutant SLP76, or with the mock vector. All showed similar levels of transduction rate determined by GFP+ cells. (L and M) Correction of the SLP76 mutant phenotype in J14. (L) SLP76-deficient Jurkat-derived human leukemic T cell line (J14) retrovirally transduced with the WT or mutant form of SLP76, or with the empty mock vector. Phosphorylation of ERK1/2 was measured using flow cytometry after PMA stimulation. The stimulation with PMA, which bypasses SLP76 signaling, causes a normal response in all cells (P value = NS). The results of three different analyses are summarized in the graph. Statistical analysis was performed using unpaired one-tailed t tests. (M) Flow cytometry measurements of CD69 expression in unstimulated and stimulated J14 cells retrovirally transduced with empty vector, WT, or the mutant form of SLP76. One representative experiment out of four is presented. (N) Correction of the SLP76 mutant phenotype in expanded T cell lymphoblasts. Expanded T cell lymphoblasts from the patient were retrovirally transduced with either WT SLP76 or empty mock vector tagged with GFP. Expanded T cells from age-matched healthy controls were retrovirally transduced only with empty mock vector tagged with GFP. These cells were stimulated with PMA, and the CD69 expression was measured on GFP+ cells using flow cytometry. For the control, the bar represents the average of two experiments, and for the patient, the bars represent data from two experiments, which include four independent samples. Stimulation with PMA revealed normal CD69 expression in all the expanded cells.

