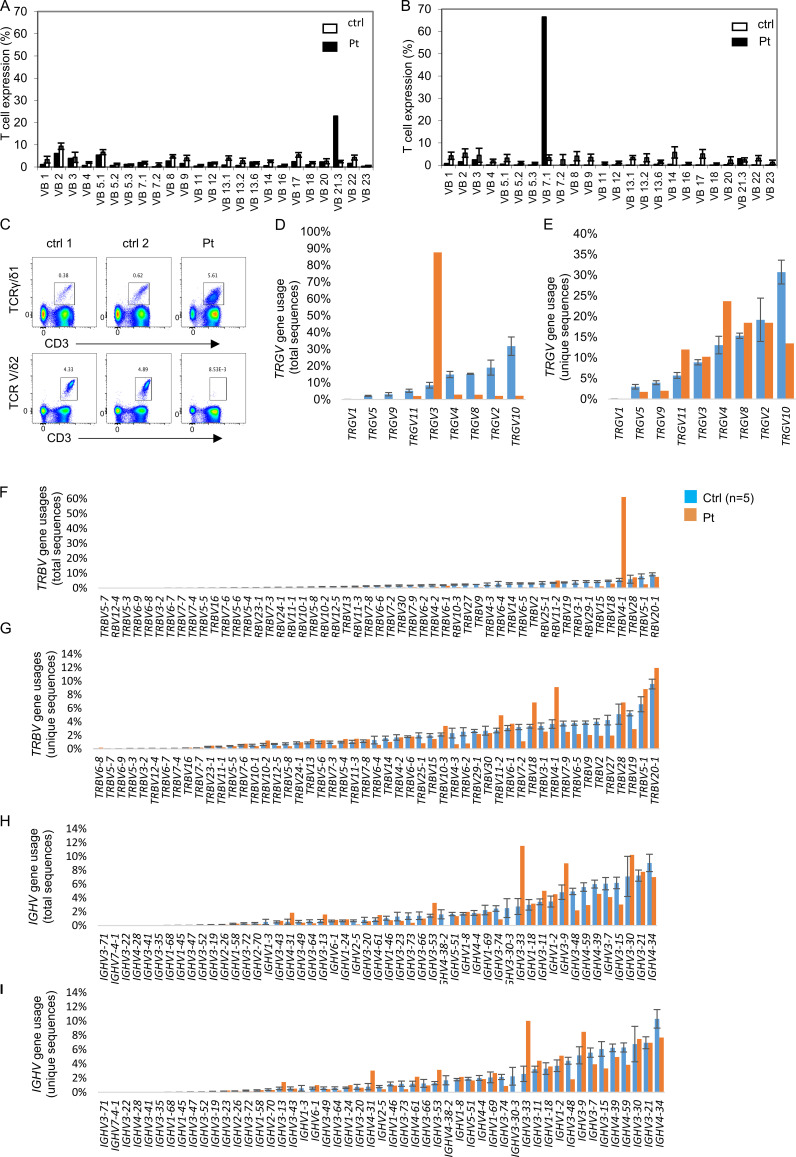
Figure S3.
T and B cell receptor repertoire in the SLP76-deficient patient. (A and B) Flow cytometry analysis of TCRVβ repertoire: Flow cytometry analysis of surface membrane expression of 24 different TRB variable gene families in the patient’s CD4 cells (A) or CD8 cells (B; black bars) compared with healthy control (white bars, n = 85, provided by the kit). The nomenclature of the TCR V genes is based on Wei et al. (1994). (C) Analysis of γδ T cells: Flow cytometry analysis of CD3+TCRγδ1+ and CD3+TCRVδ2+ cells. Analysis of the γδ T cells showed a marked skewing toward VD-1 and away from VD-2. Results are expressed as the percentage of positive cells. (D–I) Differential V gene uses in TRG, TRB, and IGH repertoires. Percentage of different V gene usages for the TRG (D and E), TRB (F and G), and IGH (H and I) repertoires is demonstrated in unique and total sequences. For the patient, each bar represents the percentage of specific gene use based on either total (D, F, and H) or unique (E, G, and I) sequences. For the control, the bar represents the average of gene uses (n = 5), and error bars represent the SE. The nomenclature of the V genes is based on IMGT (Lefranc et al., 1999).

