Figure 3.
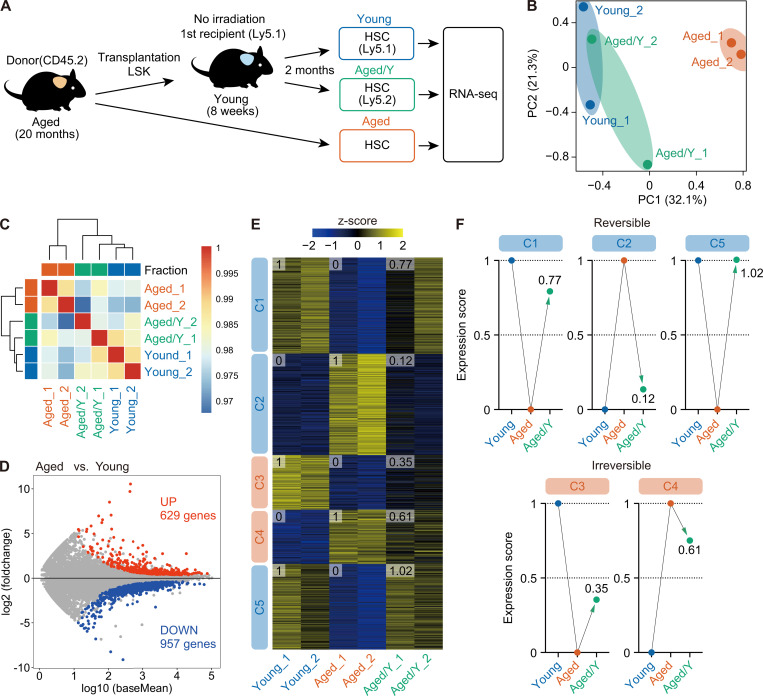
The young niche largely rejuvenates the transcriptome profile of Aged HSCs. (A) Experimental strategy. 3,000 donor-derived Aged/Y and host Young HSCs purified from primary recipients at 2 mo after transplantation of Aged HSCs without irradiation, together with 3,000 HSCs from 20-mo-old mice, were subjected to RNA-sequencing analysis. (B) PC analysis based on the row Z scores of the expression value (DESeq2 normalized counts) in Young, Aged, and Aged/Y HSCs (n = 2 each, pooled from two independent experiments). (C) Hierarchical clustering based on the Pearson’s correlation coefficient of DESeq2 normalized counts in Young, Aged, and Aged/Y HSCs (n = 2). (D) MA plot showing log10 normalized read counts and log2 fold changes in Aged versus Young HSCs. The red and blue dots represent 629 up-regulated (UP) and 957 down-regulated (DOWN) DEGs during aging. The cutoff q < 0.05 was used to define DEGs. (E) K-means clustering of DEGs defined in D. Heatmap represents the Z scores of normalized read counts in Young, Aged, and Aged/Y HSCs. The cluster numbers (C1–C5) and average gene expression scores of each HSC group are indicated. (F) Reversible and irreversible changes in average gene expression in Aged/Y HSCs. The average expression scores of DEGs in Young or Aged HSCs were scaled from 0 to 1, and the scores of DEGs in Aged/Y HSCs were normalized.

