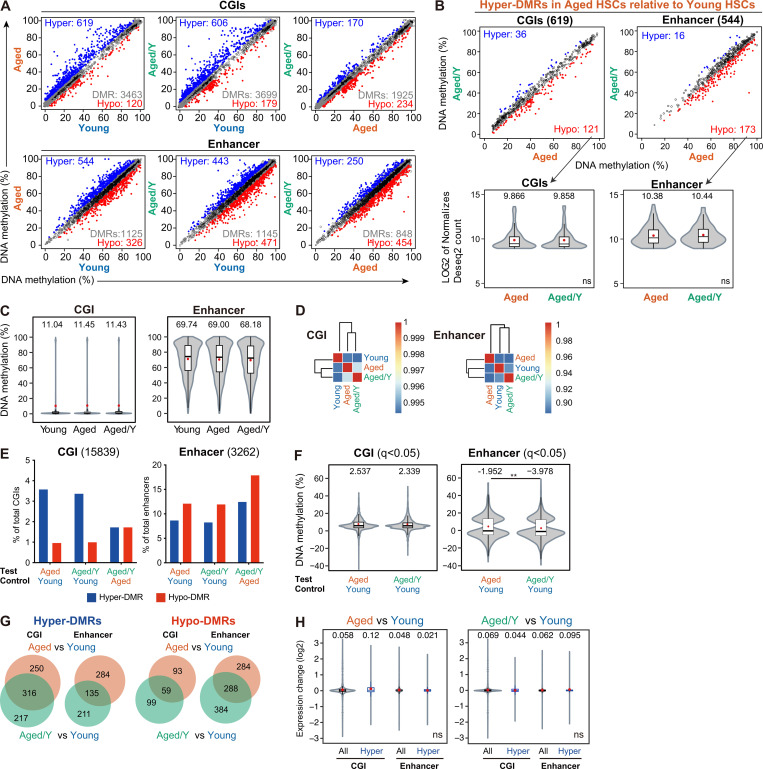
Figure S3.
Comparison of DNA methylation among Young, Aged, and Aged/Y HSCs. (A) DNA methylation values in Young, Aged, and Aged/Y HSCs at CGIs and enhancers. The blue and red dots represent hyper-and hypo-DMRs as those showing significant differences in methylation levels (q < 0.05) and a methylation difference ≥5.0%. Gray dots and white circles represent DMRs with a methylation difference <5.0% and non-DMRs, respectively. (B) DNA methylation values of hyper-DMRs in Aged HSCs relative to Young HSCs in A (619 and 544 DMRs at CGIs and enhancers, respectively) in Aged and Aged/Y HSCs (upper panels). Violin plots showing expression levels of hyper-DMR genes in Aged HSCs that lost hyper-DMRs in Aged/Y HSCs (hypo-DMR genes in Aged/Y HSCs relative to Aged HSCs; lower panels). Mean and median values are indicated as red dots and horizontal bars, respectively. (C–H) GWBS analysis (second cohort). (C) Violin plots showing the global DNA methylation levels in Young, Aged, and Aged/Y HSCs at CGIs and enhancers. Mean and median values are indicated as red dots and horizontal bars, respectively. (D) Hierarchical clustering databased on the Pearson’s correlation coefficient of DNA methylation at CGIs and enhancers in Young, Aged, and Aged/Y HSCs. (E) Percentages of hyper- and hypo-DMRs at CGIs and enhancers in Aged and Aged/Y HSCs relative to indicated HSCs. Among DMRs with significant differences in methylation levels compared with control HSCs (q < 0.05), those showing a methylation difference ≥5.0% were defined as hyper- and hypo-DMRs. (F) Violin plots showing the DNA methylation difference (percentage) in DMRs between the test (Aged or Aged/Y HSCs) and control (Young HSCs). Mean and median values are indicated as red dots and horizontal bars, respectively. (G) Venn diagrams showing the overlap of hyper- and hypo-DMRs at CGIs and enhancers between Aged and Aged/Y HSCs. Hyper- and hypo-DMRs were defined in Aged and Aged/Y HSCs using Young HSCs as a control. (H) Violin plots showing expression changes in all genes (All) and genes with hyper-DMRs at CGIs and enhancers (Hyper) between the test (Aged and Aged/Y HSCs) and control (Young HSCs). Mean and median values are indicated as red dots and horizontal bars, respectively. Data are shown as mean ± SD. **, P < 0.01; ns, not significant by Student’s t test.

