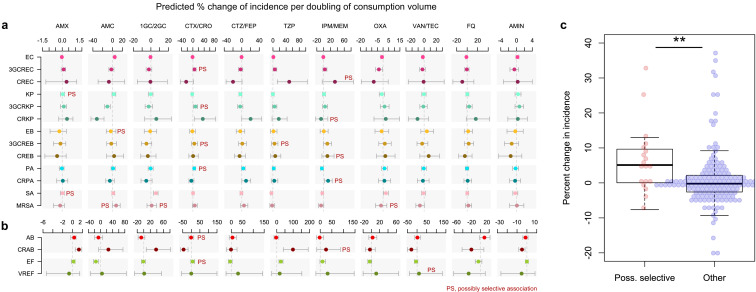
Figure 2. Possibly selective associations between the use of specific antibiotics and the incidence of infection with ESKAPE2 pathogen variants.
Shown are the predicted percent changes in incidence (points) with 95% confidence interval (bars) for each variant in each ward (n = 357) for every doubling in the consumption volume of 11 antibiotic groups, based on multivariable quasi-Poisson regression models of the incidence of each variant in each ward (n = 357) that included the connectivity and incidence control covariates (see Materials and methods). Associations classified as possibly selective (n = 19) are indicated by a ‘PS’ mark. Models involving A. baumannii and E. faecium, which exhibited larger 95% confidence intervals due to smaller incidence of the resistant variants, are shown with separate scales (panel b) for readability. (c), possibly selective associations had higher coefficients compared to other associations. The center line indicates the median; box limits indicate the upper and lower quartiles; whiskers indicate the 1.5x interquartile range; points indicate the individual coefficients. **p<0.01, two-sided Mann–Whitney U-test. Acronyms of pathogen variants and antibiotics are listed in Tables 1 and 2, respectively.

