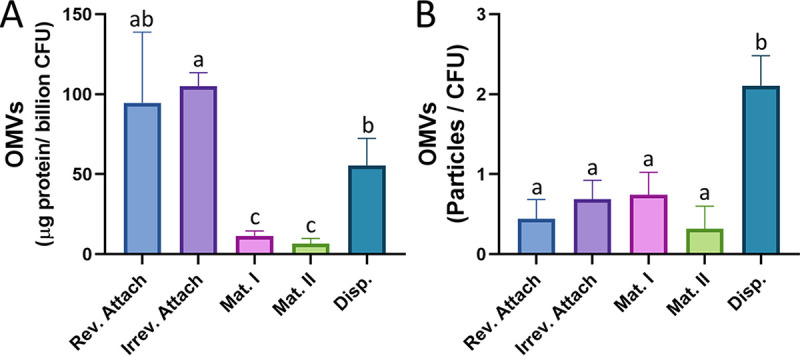
FIG 2.

OMV production varies across biofilm developmental stages. OMVs were harvested from each stage of biofilm development and quantified using two different methods. (A) Purified OMVs were quantified by the modified Lowry assay and normalized to micrograms protein per billion CFU. (B) Purified OMVs were also quantified using nanoparticle tracking and normalized to CFU. Error bars represent the standard deviations calculated from at least three biological replicates. Statistical significance was assessed by one-way ANOVA followed by Tukey’s post hoc test. Lowercase letters above the bars represent significance. Differences between bars that do not share a letter are statistically significant (P < 0.05).
