Figure 3.

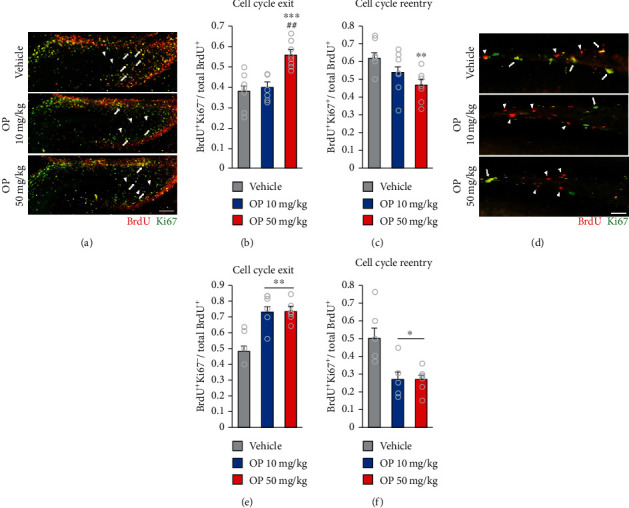
OP exposure impairs the number of cycling in dentate gyrus progenitors by increasing cell cycle exit. (a) Coronal section of E18.5 DG is stained with antibodies against Ki67 (green) and BrdU (red). Arrowheads indicate cell cycle exit cells (BrdU-positive/Ki67-negative). Arrows indicate reentry cell cycle cells (BrdU-positive/Ki67-positive). The cell cycle exit rate was calculated by dividing the number of BrdU-positive/Ki67-negative cells by the total number of BrdU-positive cells in the DG. The cell cycle reentering was calculated by dividing the number of BrdU-positive/Ki67-positive cells by the total number of BrdU-positive cells. (b) Increased proportion of cells exiting the cell cycle in the OP 50 mg/kg group compared to the vehicle and OP 10 mg/kg groups. There was no significant different between the vehicle and the OP 10 mg/kg groups (F2,20 = 14.93, p = 0.0001). (c) The OP 50 mg/kg group exhibited lower number of cells reentering the cell cycle compared to the vehicle group. The number of cells reentering the cell cycle in the OP 10 mg/kg group showed decreased number of cells reentering the cell cycle compared to that in the vehicle group but not significant different (F2,20 = 5.207, p = 0.0151). (d) Coronal images of BrdU/Ki67 colabelling in DG. (e) The OP-treated groups showed increased proportion of cells exiting the cell cycle at the DG compared to the vehicle group (F2,13 = 7.774, p = 0.0054). (f) The number of cells reentering the cell cycle in the OP-treated groups were lower compared to that in the vehicle group. There was no difference in the number of cells exiting rate and cells reentering the cell cycle between the OP 10 mg/kg and the OP 50 mg/kg groups (F2,13 = 8.089, p = 0.0052). n = 5 per group. Data represent mean ± SEM. Statistical significance was determined by one-way ANOVA with Bonferroni correction. ∗p < 0.05 vs. vehicle, ∗∗p < 0.01 vs. vehicle, ∗∗∗p < 0.001 vs. vehicle. ##p < 0.01 OP 10 mg/kg vs. OP 50 mg/kg. Scale bar: 50 μm in (a) and (d).
