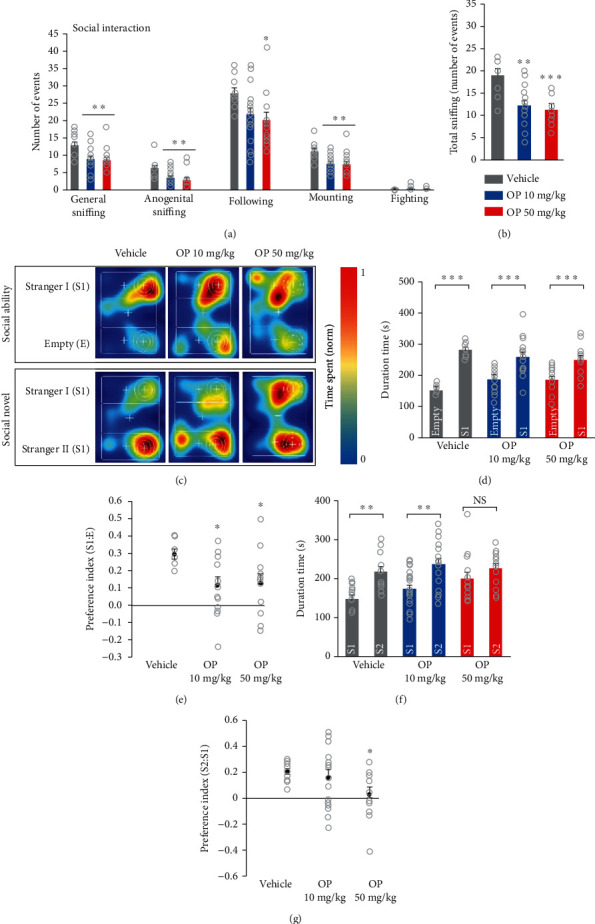
Figure 6.

OP mice display social behavioral alteration in three-chamber tests. (a) Social interaction test was performed by using an open field apparatus. The OP-treated groups showed decreased interaction compared to the vehicle group (general sniffing, anogenital sniffing, following). (b) Quantification of total sniffing. The OP-treated groups displayed lower in the total sniffing time compared to the vehicle group (F2,43 = 9.991, p = 0.0003). Statistical significance was determined by one-way ANOVA with Bonferroni correction. ∗p < 0.05 and ∗∗p < 0.01 vs. vehicle, ∗∗∗p < 0.001 vehicle vs. OP. n = 13 mice (7 males, 6 females) for vehicle, 18 mice (9 males, 9 females) for OP 10 mg/kg, 15 mice (8 males, 7 females) for OP 50 mg/kg. (c) Representative heat map images of the three-chamber test explaining procedure of sociability and novelty 10 min sessions. (d, e) During sociability session, the vehicle- and OP-treated groups spent more time in the chamber containing an unfamiliar mouse “S1” than in the empty chamber (vehicle; Empty = 152.25 ± 5.17, StrangerI = 282.99 ± 6.57, (t = 6.064, p < 0.0001); OP 10 mg/kg; Empty = 185.58 ± 8.87, StrangerI = 258.90 ± 14.17, (t = 4.385, p = 0.0001); OP 50 mg/kg; Empty = 185.25 ± 10.71, StrangerI = 250.75 ± 12.46, (t = 4.364, p = 0.0002)). However, the OP-treated group preference index was markedly lower compared to the vehicle group (F2,34 = 5.027, p = 0.0122). (f) During social novelty sessions, the vehicle and OP 10 mg/kg groups spent more time in novel chamber “S2” than in familiar chamber “S1”(vehicle; StrangerI = 147.52 ± 7.96, StrangerII = 217.94 ± 12.24, (t = 4.061, p = 0.0005); OP 10 mg/kg; StrangerI = 172.49 ± 10.63, StrangerII = 237.47 ± 14.01, (t = 3.694, p = 0.0008)). However, the OP 50 mg/kg group spent almost the same amount of time in the two chambers (OP 50 mg/kg; StrangerI = 200.10 ± 15.61, StrangerII = 227.39 ± 11.36, (t = 1.781, p = 0.0858)). (g) Social novelty index in the OP 50 mg/kg group was lower than that in the vehicle group (F2,29 = 3.639, p = 0.0389). Data represent mean ± SEM. Statistical significance was determined between times exploring empty chamber and stranger 1 or times exploring stranger 1 and stranger 2 for each group and condition by a two-tailed Student's t-test. For preference index, statistical significance was determined by one-way ANOVA with Bonferroni correction. ∗p < 0.05 and ∗∗p < 0.01 vs. vehicle, #p < 0.05 OP 10 mg/kg vs. OP 50 mg/kg. n = 11 mice (6 males, 5 females) for vehicle, 16 mice (8 males, 8 females) for OP 10 mg/kg, 13 mice (7 males, 6 females) for OP 50 mg/kg.
