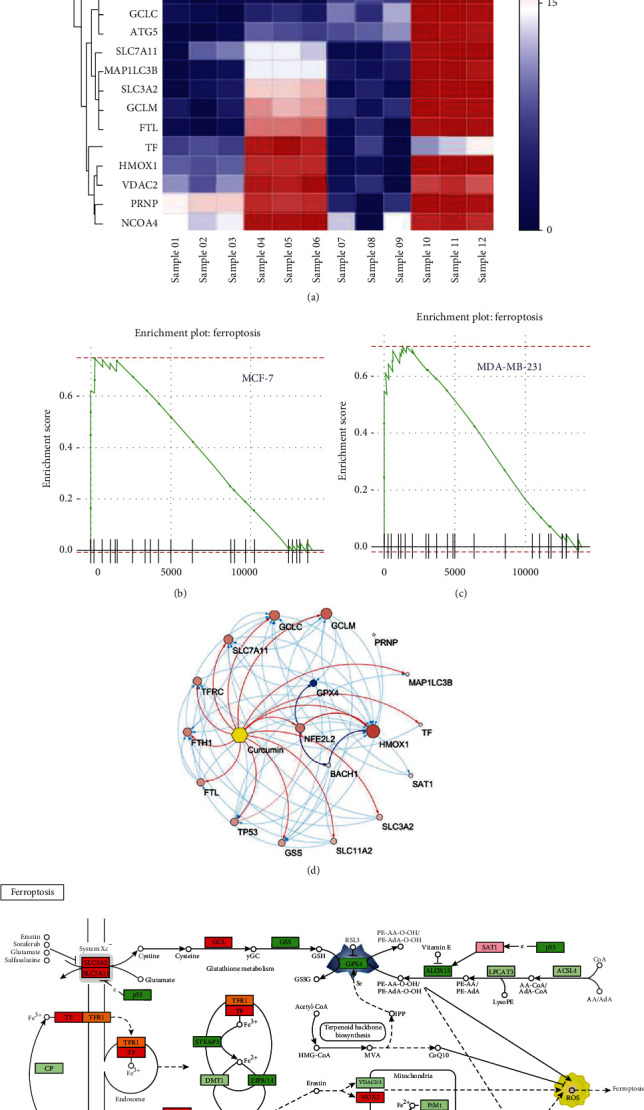
Figure 3.

Ferroptosis network analysis of breast cancer cells treated with curcumin. (a) GSEA heat map analysis showing the ferroptotic pathway. Interactive heat map (GSEA) analysis was provided by NetworkAnalyst (https://www.networkanalyst.ca/NetworkAnalyst/home.xhtml). The value of 0-30 on the color scale bar of the heat map does not represent the relative fold change degree; each value is ranked on DE method used; the minimum value is 0, and the maximum value is 30, which has been explained by the literature provided by the official website [25]. (b, c) GSEA results based on KEGG pathways with enriched genes, indicating that the ferroptotic signaling pathway was upregulated by curcumin in both cell lines. (d) Cytoscape was used to construct a target gene interaction network diagram showing the ferroptotic pathways affected by curcumin according to the STRING database. (e) The ferroptotic pathway model was obtained from the KEGG pathway analysis results. The green boxes indicate genes that were downregulated by curcumin treatment. The red boxes indicate genes that were upregulated by curcumin treatment.
