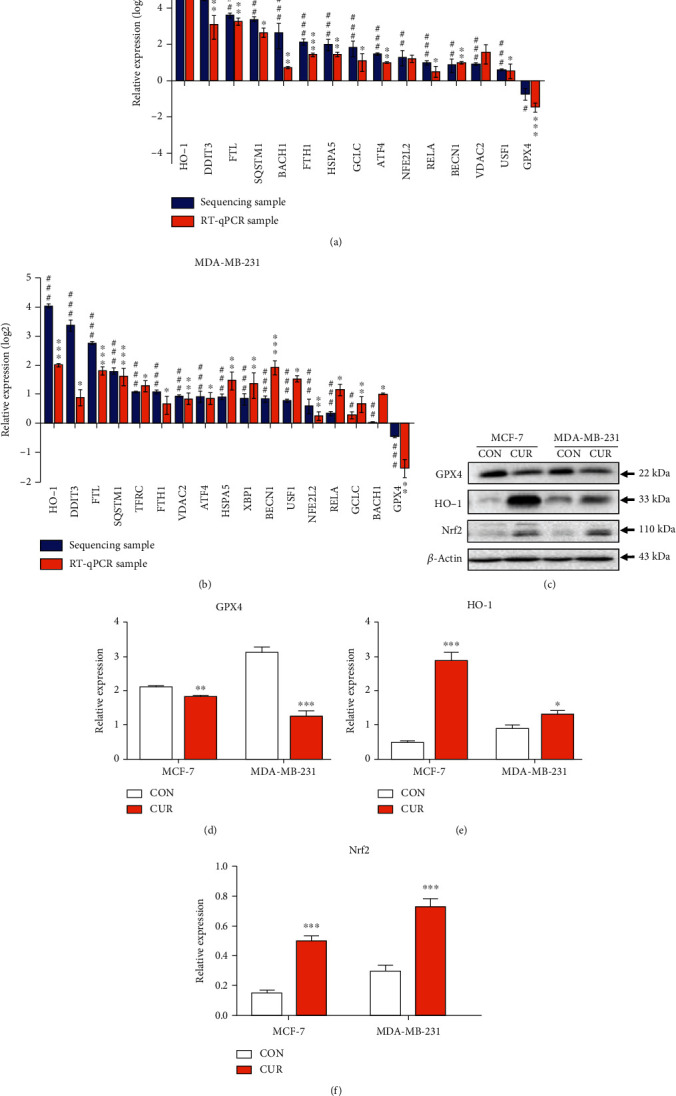
Figure 5.

RT-qPCR verification of RNA associated with the ferroptotic pathway. (a) Total RNA extracted from MCF-7 cells treated with 40 μM curcumin (CUR) for 48 hours was analyzed by RT-qPCR for gene expression analysis. The expression levels of mRNA were normalized to the level of β-actin. Each reported value represents the mean ± SEM from three independent experiments. ∗P < 0.05; ∗∗P < 0.01; ∗∗∗P < 0.001, compared to CON (control, RT-qPCR samples). #P < 0.05; ##P < 0.01; ###P < 0.001, compared to CON (control, sequencing samples). (b) Total RNA extracted from MDA-MB-231 cells treated with 50 μM curcumin (CUR) for 48 hours was analyzed by RT-qPCR for gene expression analysis. The expression levels of mRNA were normalized to the level of β-actin. Each reported value represents the mean ± SEM of three independent experiments. ∗P < 0.05; ∗∗P < 0.01; ∗∗∗P < 0.001, compared to CON (control, RT-qPCR samples). #P < 0.05; ##P < 0.01; ###P < 0.001, compared to CON (control, sequencing samples). (c) MCF-7 cells were treated with vehicle or 40 μM curcumin for 48 h, and MCF-MB-231 cells were treated with vehicle or 50 μM curcumin for 48 h. Cells were then harvested for the western blot analysis. The representative figure shows one of the three independent experiments. (d) Quantitative results for the GPX4 expression in breast cancer cells as determined from greyscale analysis of (c) using the ImageJ software. The results are expressed as the means ± SEM of three independent experiments; ∗∗P < 0.01; ∗∗∗P < 0.001, compared to CON (control). (e) Quantitative results of the HO-1 expression in breast cancer cells determined by greyscale analysis of (c) using the ImageJ software. The results are expressed as the means ± SEM of three independent experiments; ∗P < 0.05; ∗∗∗P < 0.001, compared to CON (control). (f) Quantitative results of the Nrf2 expression in breast cancer cells determined by greyscale analysis of (c) using the ImageJ software. The results are expressed as the means ± SEM of three independent experiments; ∗∗∗P < 0.001, compared to CON (control). All CON (control) groups treated above received the same volume of reagent solvent as the treatment groups.
