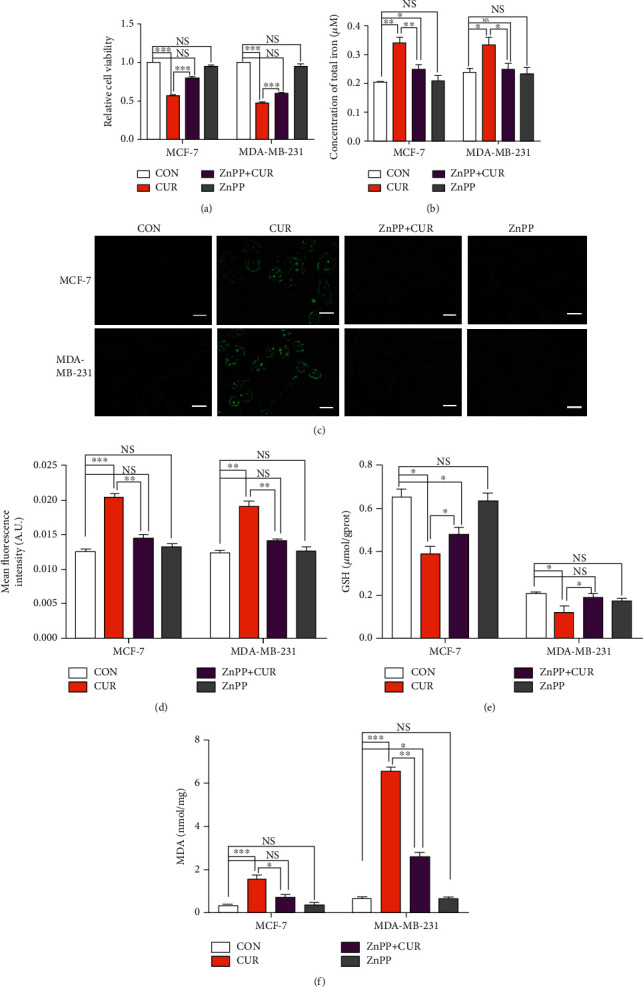
Figure 7.

Curcumin upregulates the expression of HO-1 in breast cancer cells and triggers ferroptosis, as verified by ZnPP treatment. (a) Cell viability after treatment and under basal conditions (i.e., untreated cells) as measured by the CCK-8 assay. MCF-7 cells were treated with vehicle (CON, DMSO), curcumin (CUR, 40 μM), or a mixture of 40 μM curcumin and zinc protoporphyrin 9 (ZnPP, 10 μM) for 48 hours. MDA-MB-231 cells were treated with vehicle (CON, DMSO), curcumin (CUR, 50 μM), or a mixture of 50 μM curcumin and zinc protoporphyrin 9 (ZnPP, 10 μM) for 48 hours. The results are expressed as the means ± SEM of three independent experiments. ∗∗∗P < 0.001. NS: no significant difference compared to CON alone. (b) Iron assay kit to detect changes in the total iron content in cells. The cell treatment method is the same as for (a). The results are expressed as the means ± SEM of three independent experiments. ∗P < 0.05 and ∗∗P < 0.01. NS: no significant difference compared to CON alone. (c) Using Liperfluo to detect changes in the lipid peroxide content in cells. The cell treatment method was the same as for (a). After incubation with 2 μM Liperfluo, cells were washed and examined by a fluorescence microscopy (scale bar represents 50 μm). Representative images from three independent experiments are shown. (d) The results of lipid peroxide upregulation in breast cancer cells were determined by fluorescence analysis using the ImageJ software. The results are expressed as the means ± SEM of three independent experiments; ∗∗P < 0.01; ∗∗∗P < 0.001. NS: no significant difference compared to CON alone. All the CON groups treated above received the same volume of reagent solvent as the treatment group. (e) The GSH detection kit was used to detect changes in the GSH content in cells. The cell treatment method is the same as for (a). The results are expressed as the means ± SEM of three independent experiments. ∗P < 0.05; NS: no significant difference compared to CON alone. (f) The MDA detection kit was used to detect changes in the MDA content in cells. The cell treatment method is the same as for (a). The results are expressed as the means ± SEM of three independent experiments. ∗P < 0.05; ∗∗P < 0.01; ∗∗∗P < 0.001. NS: no significant difference compared to CON alone. All CON groups treated above received the same volume of reagent solvent as the treatment group.
