Figure 1.

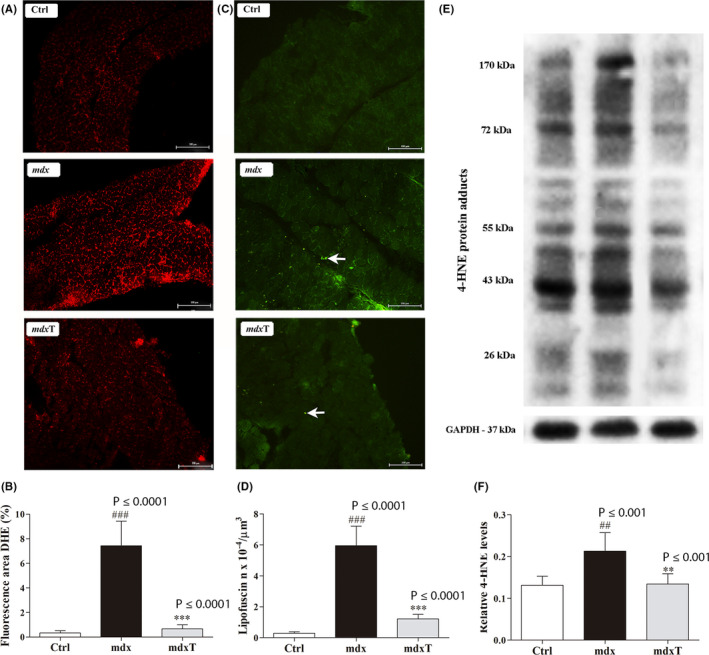
Tempol effects on the oxidative stress markers in the wild‐type and dystrophic diaphragm muscle. A, Diaphragm (DIA) cross sections showing dihydroethidium (DHE) fluorescence in wild‐type C57BL/10 (Ctrl), saline‐treated mdx mice (mdx) and tempol‐treated mdx mice (mdxT). Scale bar: 100 µm. B, The graphs show the DHE staining area (%) in wild‐type C57BL/10 (Ctrl), mdx and mdxT groups. C, DIA cross sections showing autofluorescent lipofuscin granules (white arrow) in wild‐type C57BL/10 (Ctrl), mdx and mdxT groups. Scale bar: 100 µm. D, The graphs show the number of lipofuscin granules × 10−4/µm3 in wild‐type C57BL/10 (Ctrl), mdx and mdxT groups. E, Western blotting analysis of 4‐hydroxynonenal (4‐HNE)‐protein adducts in wild‐type C57BL/10 (Ctrl), mdx and mdxT groups. Bands corresponding to protein (top row), and glyceraldehyde‐3‐phosphate dehydrogenase (GAPDH; used as a loading control) (bottom row), are shown. F, The graphs show protein levels in the crude extracts of DIA muscle of wild‐type C57BL/10 (Ctrl), mdx and mdxT groups. All values expressed as mean ± standard deviation (SD). ## P ≤ .001 vs Ctrl group, ### P ≤ .0001 vs Ctrl group, **P ≤ .001 vs Ctrl group ***P ≤ .0001 vs mdx Ctrl group (one‐way ANOVA with Tukey's post hoc test)
