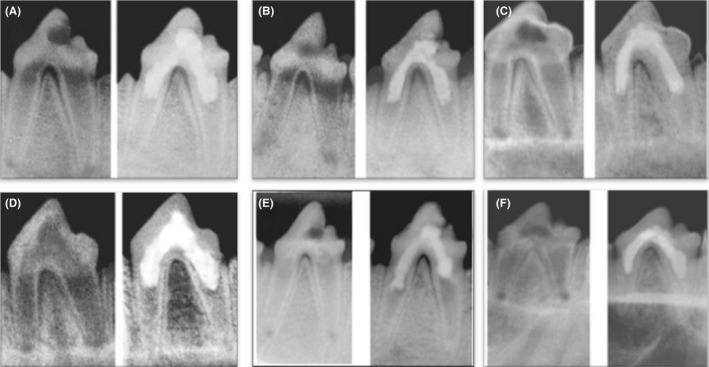
FIGURE 3.

Representative prei‐operative (left side) and postoperative (right side) radiographs of group III after 1 mo (A), 2 mo (B) and 3 mo (C) and group IV after 1 mo (D), 2 mo (E) and 3 mo (F) showing increase in the root length and thickness and decrease in apical diameter
