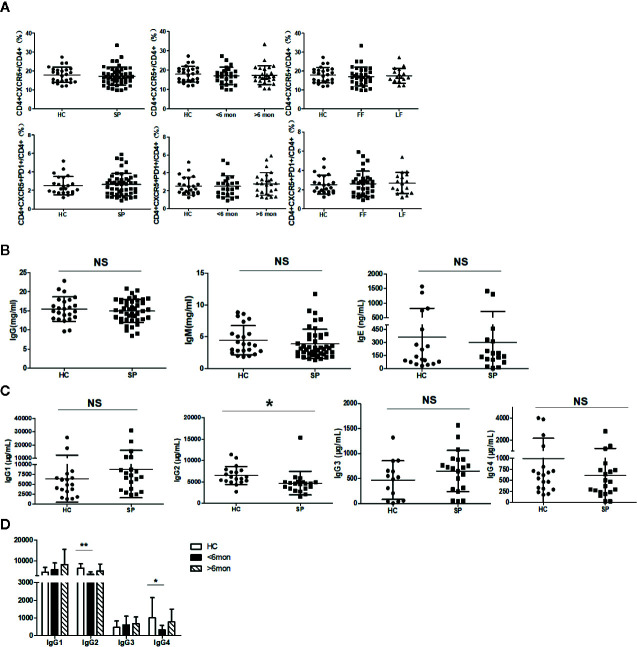
Figure 4.
Unchanged cTfh cells and altered Ig profile in sporotrichosis patients. (A) Statistical graphs in the upper row were for CD4+CXCR5+Tfh while the lower row were for CD4+CXCR5+PD1+Tfh. The comparison of cTfh percentages were between HC (n = 24) and whole patients (n = 50), patients with different duration (< 6 mon, n = 24; > 6 mon, n = 26) and clinical types (FF, n = 33; LF, n = 17). (B) Comparison of serum levels of total IgG, IgM, and IgE between patients (n = 46) and HC (n = 24). (C, D) Distribution of IgG subtypes (IgG1, IgG2, and IgG3 and IgG4) in patients (in whole: n = 20; SD: n = 7; LD: n = 13) and HC (n = 19). Error bars represent mean±SD. *P < 0.05, **P < 0.01, and NS P ≥ 0.05.

