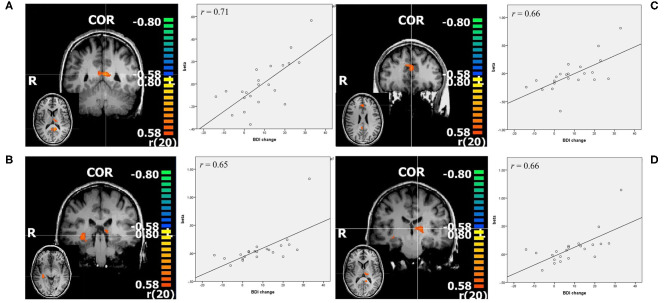
Figure 3.
Resulting regions of correlation analysis with change in BDI in contrast negative>neutral. The color bars represent r values, p < 0.005. (A) PCC: posterior cingulate cortex; (B) right hippocampus; (C) ACC; pregenual anterior cingulate cortex; (D) left thalamus, all shown in coronal slice, with transverse slice shown in small. Additionally scatterplots of the depicted regions beta values and change in BDI are shown, as well as r = Pearson's correlation coefficient.

