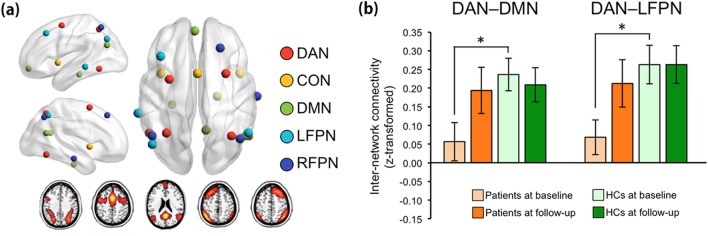
Figure 2.
Results from the network analysis using statistical parametric mapping (SPM) 12 software. (a) Figures illustrating the location of nodes within each of the functional brain networks, including the dorsal attention network (DAN; red), cingulo-opercular network (CON; yellow), default-mode network (DMN; green), left frontoparietal network (LFPN; sky), and right frontoparietal network (RFPN, blue). The bottom shows activation maps of each component (i.e., functional brain networks) extracted by independent component analysis. (b) DAN–DMN and DAN–LFPC internetwork FC during performance of the ToL task. The horizontal lines for each group indicate the means, and the vertical lines for each group indicate the standard deviations. *Indicates that the mean difference is significant at the 0.05 level.

