FIGURE 6.
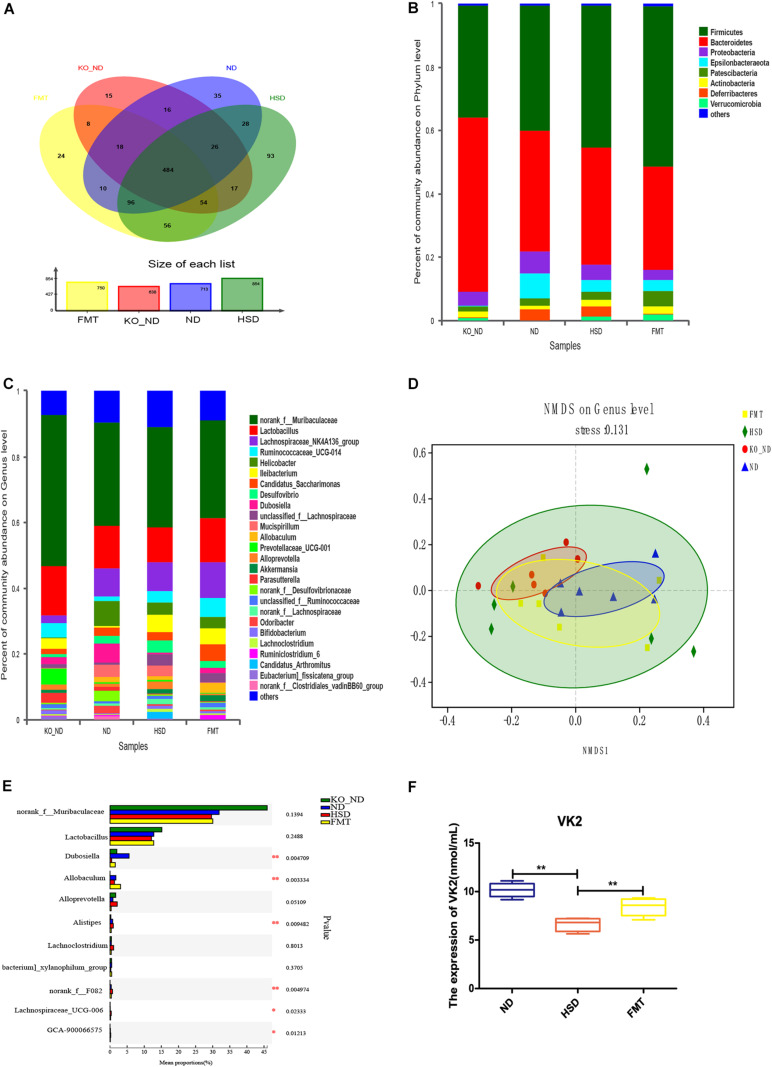
FMT using Atf4± mice fecal microbiota altered the composition of gut microbiota and expression of the microbial metabolite VK2 in high-salt-induced hypertensive mice. (A) Venn diagram of OTUs. Different colors represent different groups. (B) Relative abundance plots displaying the differences in the microbial community structure at the phylum level. (C) Relative abundance plots displaying the differences in the general microbial community structure. (D) NMDS plots were used to visualize differences in weighted UniFrac distances at the genus level of samples from different groups. (E) The 11 taxonomic groups associated with FMT. *p < 0.05 and **p < 0.01. (F) FMT upregulated the expression of VK2. Data are presented as mean ± SD; **p < 0.01, n = 6–8; statistical comparisons were performed using Student t-test or one-way analysis of variance (ANOVA). FMT, fecal microbiota transplantation; VK2, vitamin K2; KO-ND, Atf4± mice with natural diet; ND, WT mice with natural diet; HSD, WT mice with high-salt diet.

