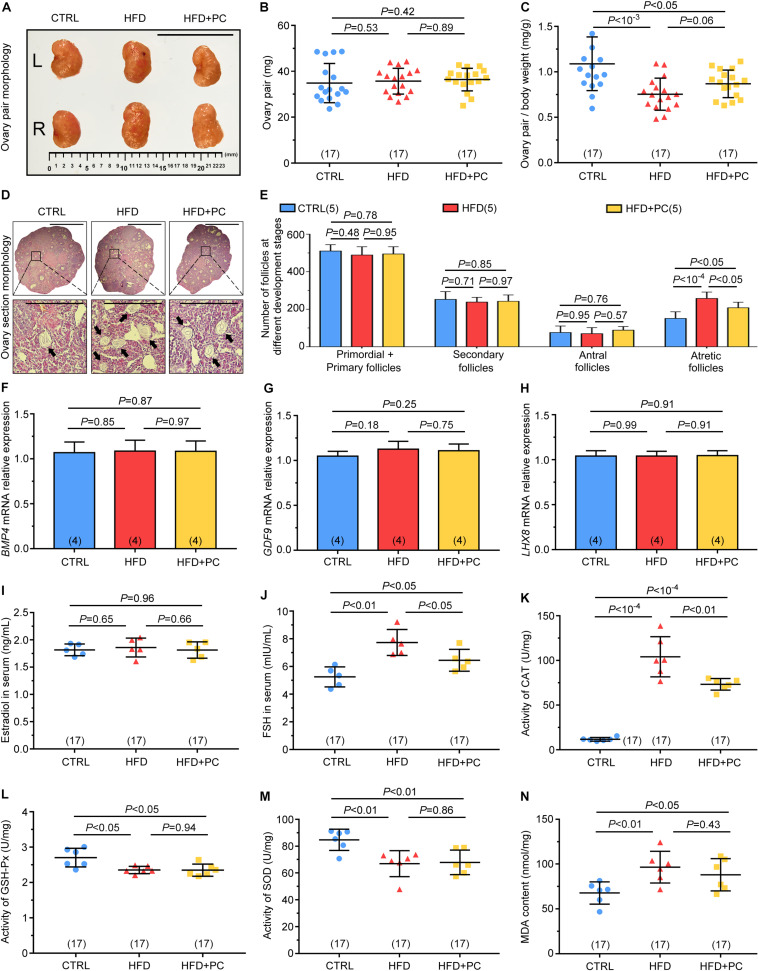
FIGURE 3.
PC promoted follicular development and reduced CAT and FSH levels in obese mice. (A) Macroscopic representations of the ovaries, scale bar = 10 μm. (B) Ovary-pair weights. (C) Ovary-pair ratio coefficients. (D) Typical histological image of H&E-stained follicles, scale bar = 50 μm, with black arrows indicating atretic follicles. (E) The statistics for follicles at different developmental stages in the ovaries. (F) Relative expressions of BMP4 mRNA. (G) Relative expressions of GDF9 mRNA. (H) Relative expressions of LHX8 mRNA. (I) Estradiol levels. (J) FSH levels. (K) CAT activities. (L) GSH-Px activities. (M) SOD activities. (N) MDA contents. Data are expressed as mean ± SD and were compared by one-way ANOVA and Newman–Keuls post hoc tests. The number of ovary pairs in each group is shown in parentheses.

