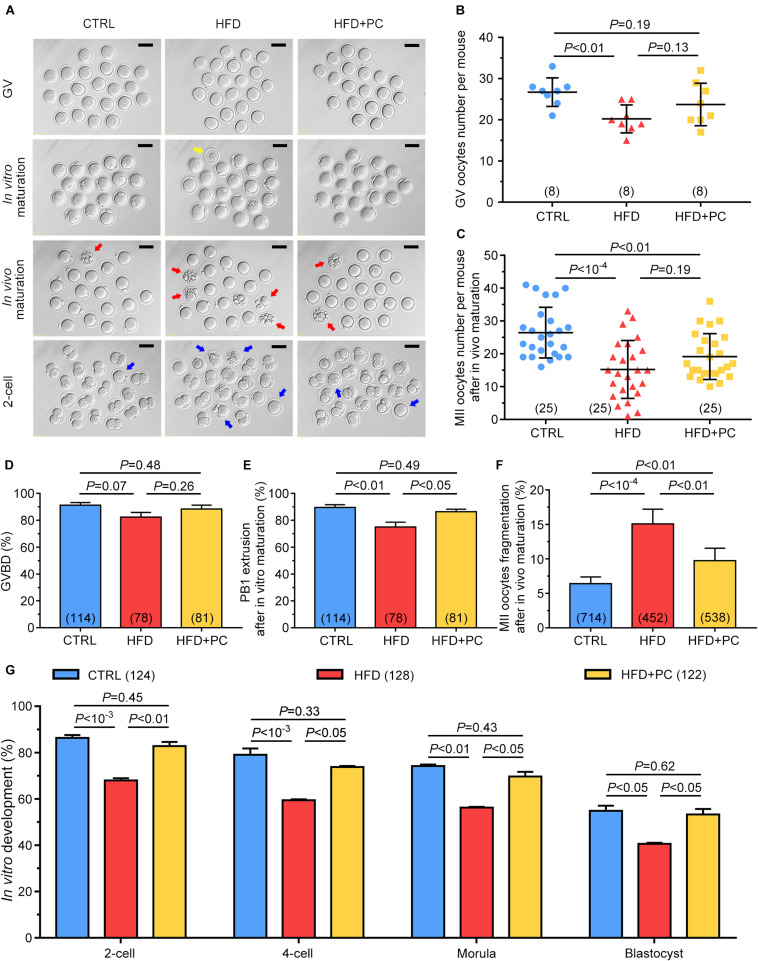
FIGURE 4.
PC rescued oocyte quality in obese mice. (A) Representative morphological images of GV, in vivo or in vitro matured oocytes, and 2-cell stage embryos. The yellow arrow indicates an oocyte with degenerated cytoplasm, red arrows indicate fragmented oocytes, and blue arrows indicate oocytes with failed fertilization or cleavage. Scale bar = 100 μm. (B) Number of GV oocytes per mouse. (C) Number of MII oocytes per mice after in vivo maturation. (D) The percentage of oocytes that underwent GVBD. (E) The percentage of in vitro cultured GV oocytes that underwent PB1 extrusion. (F) The percentage of oocytes with fragmentation morphologies. (G) The percentage development to 2-cell, 4-cell, morula, and blastocyst embryos. Data are expressed as mean ± SD and were compared by one-way ANOVA and Newman–Keuls post hoc tests. The number of mice assessed in each group is indicated in parentheses for (B,C). The number of oocytes or embryos assessed in each group is indicated in parentheses for (D–G).

