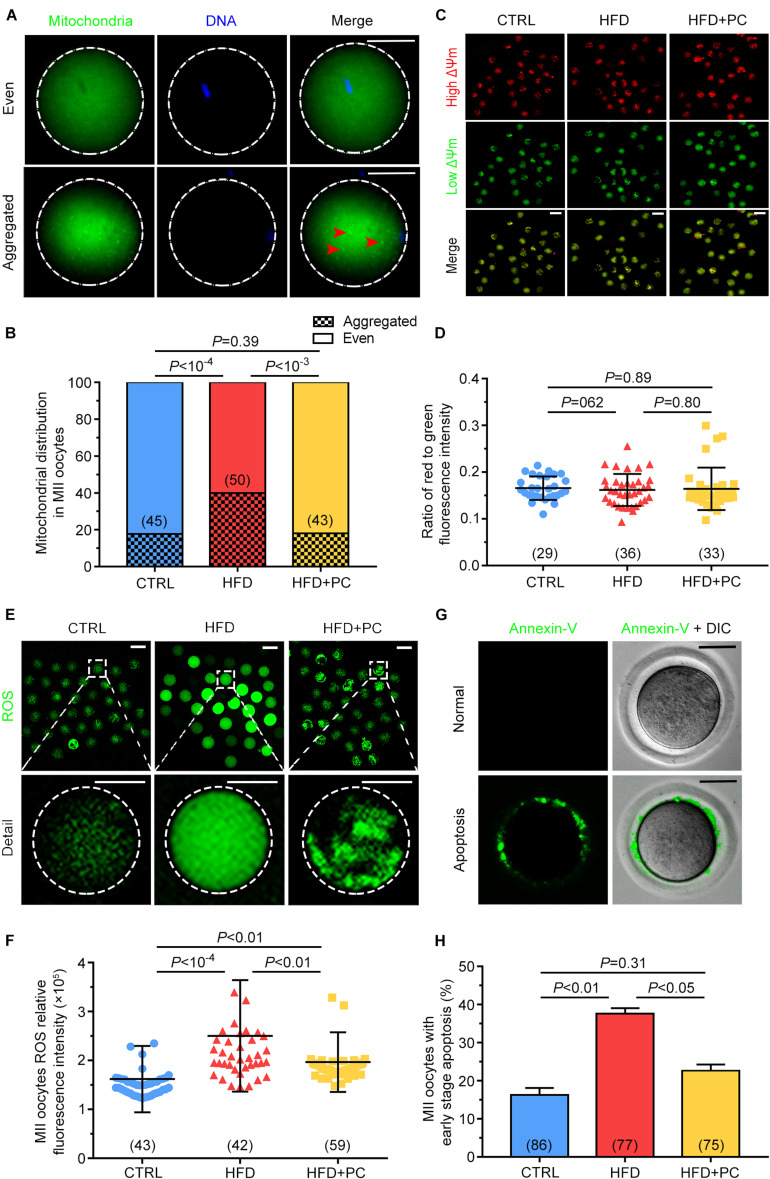
FIGURE 6.
PC restored the mitochondrial distribution in oocytes, and attenuated oxidative stress and early apoptosis in obese mice. (A) Representative images of mitochondria with even or aggregated distributions. Red arrows indicate aggregated mitochondria. Green, mitochondria; blue, DNA. The circular white frame indicates the oocyte edge. Scale bar = 20 μm. (B) Percentages of MII oocytes with altered mitochondrial distributions. (C) Representative images of mitochondrial membrane potentials. Red, high ΔΨm; Green, low ΔΨm. Scale bar = 100 μm. (D) Ratio of red to green fluorescence intensities from (C). (E) Representative images of ROS generation determined by DCFH-DA fluorescence (green). Scale bar = 100 μm. The square white frame indicates the region shown in detail, and the circular white frame indicates the oocyte edge. (F) Quantification of ROS fluorescence intensities. (G) Representative images of early stage apoptosis in MII oocytes. No green fluorescence signals were observed in oocyte membranes, indicating no apoptosis (upper panel). Oocytes undergoing early apoptosis were characterized by an unambiguous green membrane signal (lower panel). Scale bar = 100 μm. (H) Percentages of oocytes undergoing early stage apoptosis. Data are expressed as mean ± SD and were compared by one-way ANOVA and Newman–Keuls post hoc tests. The number of oocytes assessed in each group is shown in parentheses.

