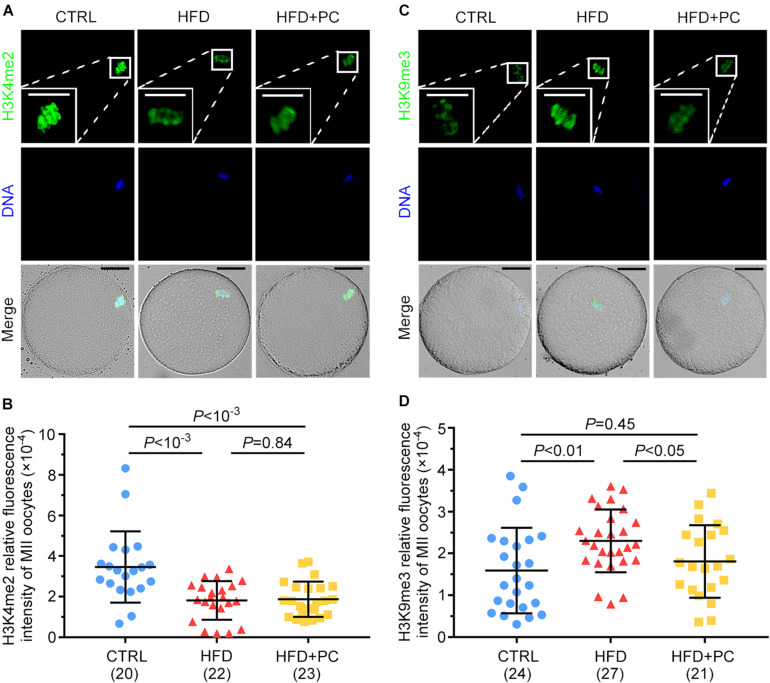
FIGURE 7.
PC reversed the abnormal expression of H3K9me3 in obese mice. (A) Representative images of H3K4me2 inside oocytes. Green, H3K4me2; blue, DNA. The square white frame indicates the region shown in detail. Scale bar = 20 μm. (B) Quantified fluorescence intensities for H3K4me2. (C) Representative images of H3K9me3 inside oocytes. Green, H3K9me3; blue, DNA. The square white frame indicates the region shown in detail. Scale bar = 20 μm. (D) Quantified fluorescence intensities for H3K9me3. Data are expressed as mean ± SD and were compared by one-way ANOVA and Newman–Keuls post hoc tests. The number of oocytes assessed in each group is shown in parentheses.

