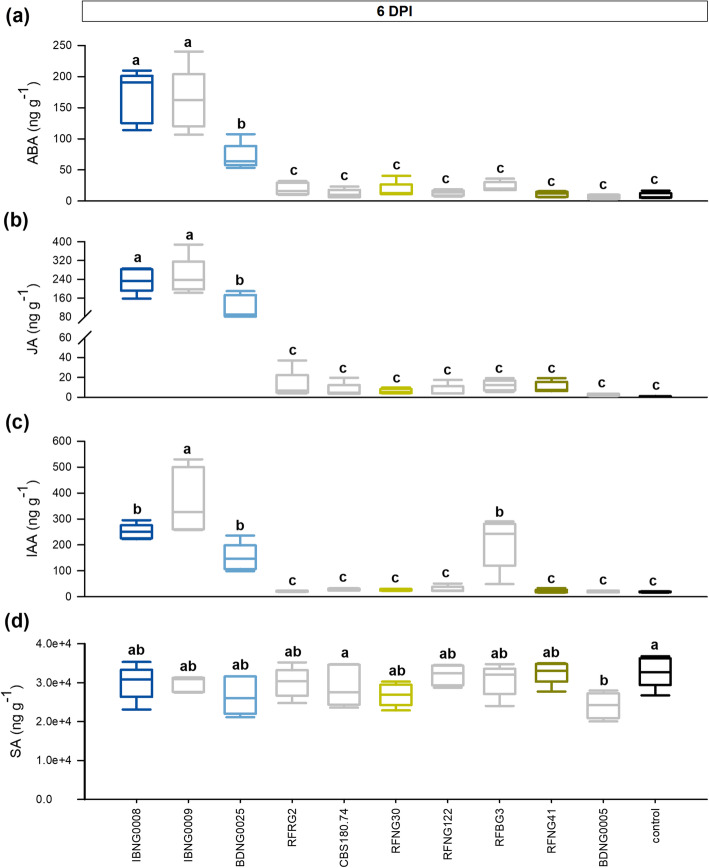
Fig. 3.
Phytohormone levels in sheath rot lesion caused by Sarocladium oryzae infection. When 7 weeks old, rice plants were inoculated with various S. oryzae isolates using the standard grain inoculum technique. Sheath samples were collected at 6 days post inoculation (DPI) and the levels of abscisic acid (a), jasmonate (b), auxin (c) and salicylic acid (d) were measured. The four S. oryzae isolates that were described above are represented by dark blue (IBNG0008), light blue (BDNG0025), dark green (RFNG41) and light green (RFNG30) boxplots; black boxplots show the results of the healthy control plants. All boxplots represent the median with the first and third quartile, the whiskers show the minimum and maximum values. Boxplots marked with different letters are statistically different (ANOVA, n = 5, α = 0.05)

