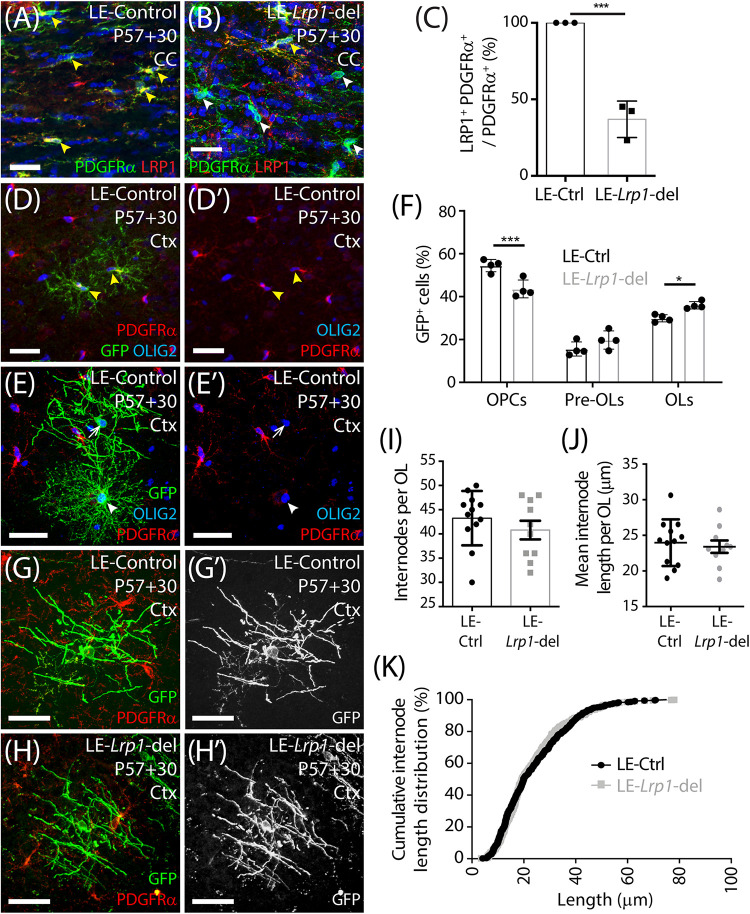
FIGURE 5.
Lrp1 deletion increases the number of mature, myelinating OLs added to the motor cortex of adult mice. (A,B) Compressed confocal z-stack from the corpus callosum (CC) of P57+30 LE-control (Pdgfrα-CreERT2) and LE-Lrp1-deleted (Pdgfrα-CreERT2 :: Lrp1fl/fl) mice that were immunolabeled to detect OPCs (PDGFRα, green), LRP1 (red), and Hoechst 33342 (blue). Solid yellow arrowheads indicate OPCs that express LRP1. Solid white arrowheads indicate OPCs that do not express LRP1. (C) The proportion (%) of PDGFRα+ OPCs in the CC of LE-control and the LE-Lrp1-deleted mice that express LRP1 (mean ± SD for n = 3 mice per group; unpaired t-test, ***p < 0.001). (D–E′) Compressed confocal z-stack from the motor cortex (Ctx) of a P57+30 control (LE-Pdgfrα-CreERT2 :: Tau-mGFP) mouse immunolabeled to detect PDGFRα (red), GFP (green), and OLIG2 (blue). Solid yellow arrowheads indicate GFP+ PDGFRα+ OLIG2+ OPCs. Solid white arrowhead indicates a GFP+ PDGFRα-neg OLIG2+ newborn pre-myelinating OL. The white arrow indicates a GFP+ PDGFRα-neg OLIG2+ newborn myelinating OL. (F) Quantification of the proportion (%) of GFP+ cells that are PDGFRα+ OLIG2+ OPCs, PDGFRα-neg OLIG2+ premyelinating OLs (pre-OLs) and PDGFRα-neg OLIG2+ myelinating OLs (OLs) [mean ± SD for n = 4 mice per genotype; 2-way ANOVA: Maturation stage F (2,18) = 195.1, p < 0.0001; Genotype F (1, 18) = 0.032, p = 0.85; Interaction F (2, 18) = 17.1, p < 0.0001]. Bonferroni multiple comparisons: *p = 0.046 and ***p = 0.0004. (G–H′) Compressed confocal z-stack showing GFP+ PDGFRα-neg myelinating OLs in the motor cortex of P57+30 LE-control and LE-Lrp1-deleted mice. (I) The number of internodes elaborated by individual GFP+ myelinating OLs in the motor cortex of LE-control and LE-Lrp1-deleted mice (mean ± SEM for n ≥ 10 OLs from n = 3 mice per genotype; Mann–Whitney Test, p = 0.38). (J) The average length of internodes elaborated by individual GFP+ myelinating OLs in LE-control and LE-Lrp1-deleted mice (mean ± SEM for n ≥ 10 OLs from n = 3 mice per genotype; unpaired t-test, p = 0.67). (K) Cumulative length distribution plot for GFP+ internodes measured in the motor cortex of P57+30 LE-control and LE-Lrp1-deleted mice (n = 519 LE-control GFP+ internodes and n = 408 LE-Lrp1-deleted GFP+ internodes measured from n = 3 mice per genotype; K-S test, D = 0.053, p = 0.5). Scale bars represent 34 μm (A,B) or 17 μm (G,H).

