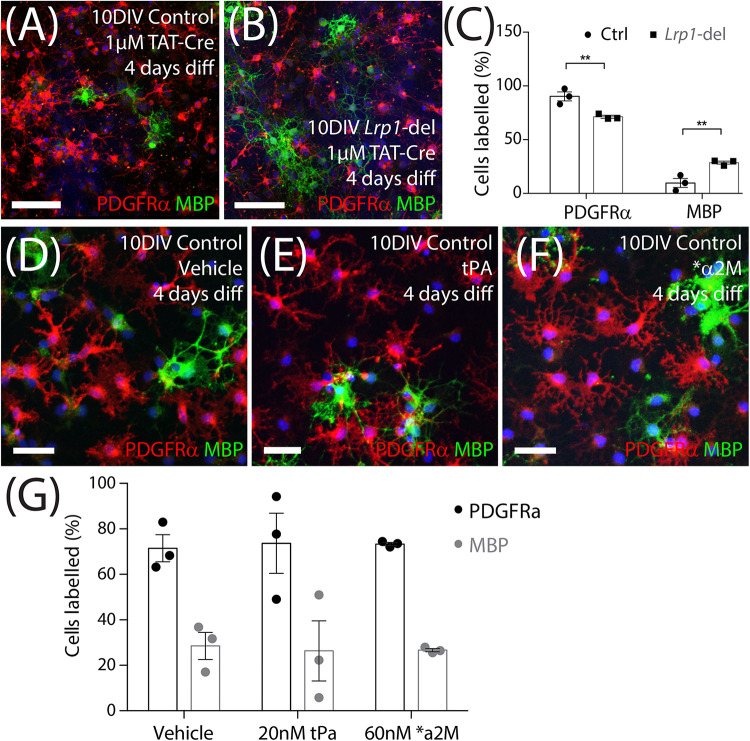
FIGURE 8.
Lrp1 deletion increases OPC differentiation in vitro. (A,B) Control and Lrp1-deleted OPCs were exposed to Tat-Cre, cultured for a further 48-h, and then transferred to differentiation medium for 4 days. Compressed confocal z-stack showing differentiated control and Lrp1-deleted (Lrp1fl/fl) OPC cultures immunolabeled to detect OPCs (PDGFRα, red), OLs (MBP, green), and all cell nuclei (Hoechst 33342, blue). (C) Quantification of the proportion (%) of cells that were PDGFRα+ OPCs or MBP+ OLs in control and Lrp1-deleted cultures [mean ± SEM for n = 3 independent cultures per genotype; 2-way ANOVA: Cell type F (1, 8) = 212, p < 0.0001; Genotype F (1, 8) = 0.001, p = 0.97; Interaction F (1, 8) = 19.9, p = 0.02]. Bonferroni multiple comparisons: **p = 0.005. (D–F) Compressed confocal z-stack shows OPCs from control mice that were transferred into differentiation medium and exposed to vehicle (MilliQ water; D), tPa (E), or *α2M (F) for 4 days before being immunolabeled to detect OPCs (PDGFRα, red), OLs (MBP, green), and all cell nuclei (Hoechst 33342, blue). (G) Quantification of the proportion (%) of OPCs that became PDGFRα+ OPCs or MBP+ OLs after 4 days in differentiation medium with vehicle, tPa or *α2M [mean ± SEM, n = 3 independent cultures per treatment; 2-way ANOVA: Cell type F (1, 12) = 44.6, p < 0.0001; Treatment F (2, 10) = 0, p = 1; Interaction F (2, 12) = 0.03, p = 0.97]. tPa = tissue plasminogen activator; *α2M = activated α2 macroglobulin. Scale bars represent 34 μm (A,B) or 17 μm (D–F).

